Smart money charts: a stock charting tool that shows who bought, and when
Insider purchases, unusual options positions, congressional disclosures, fund filings, buybacks, volume thrusts, candle patterns and reversals — each drawn on the price chart on the day it became public, so you never cross-check a date against a table again.
Every feature unlocked. No credit card required.
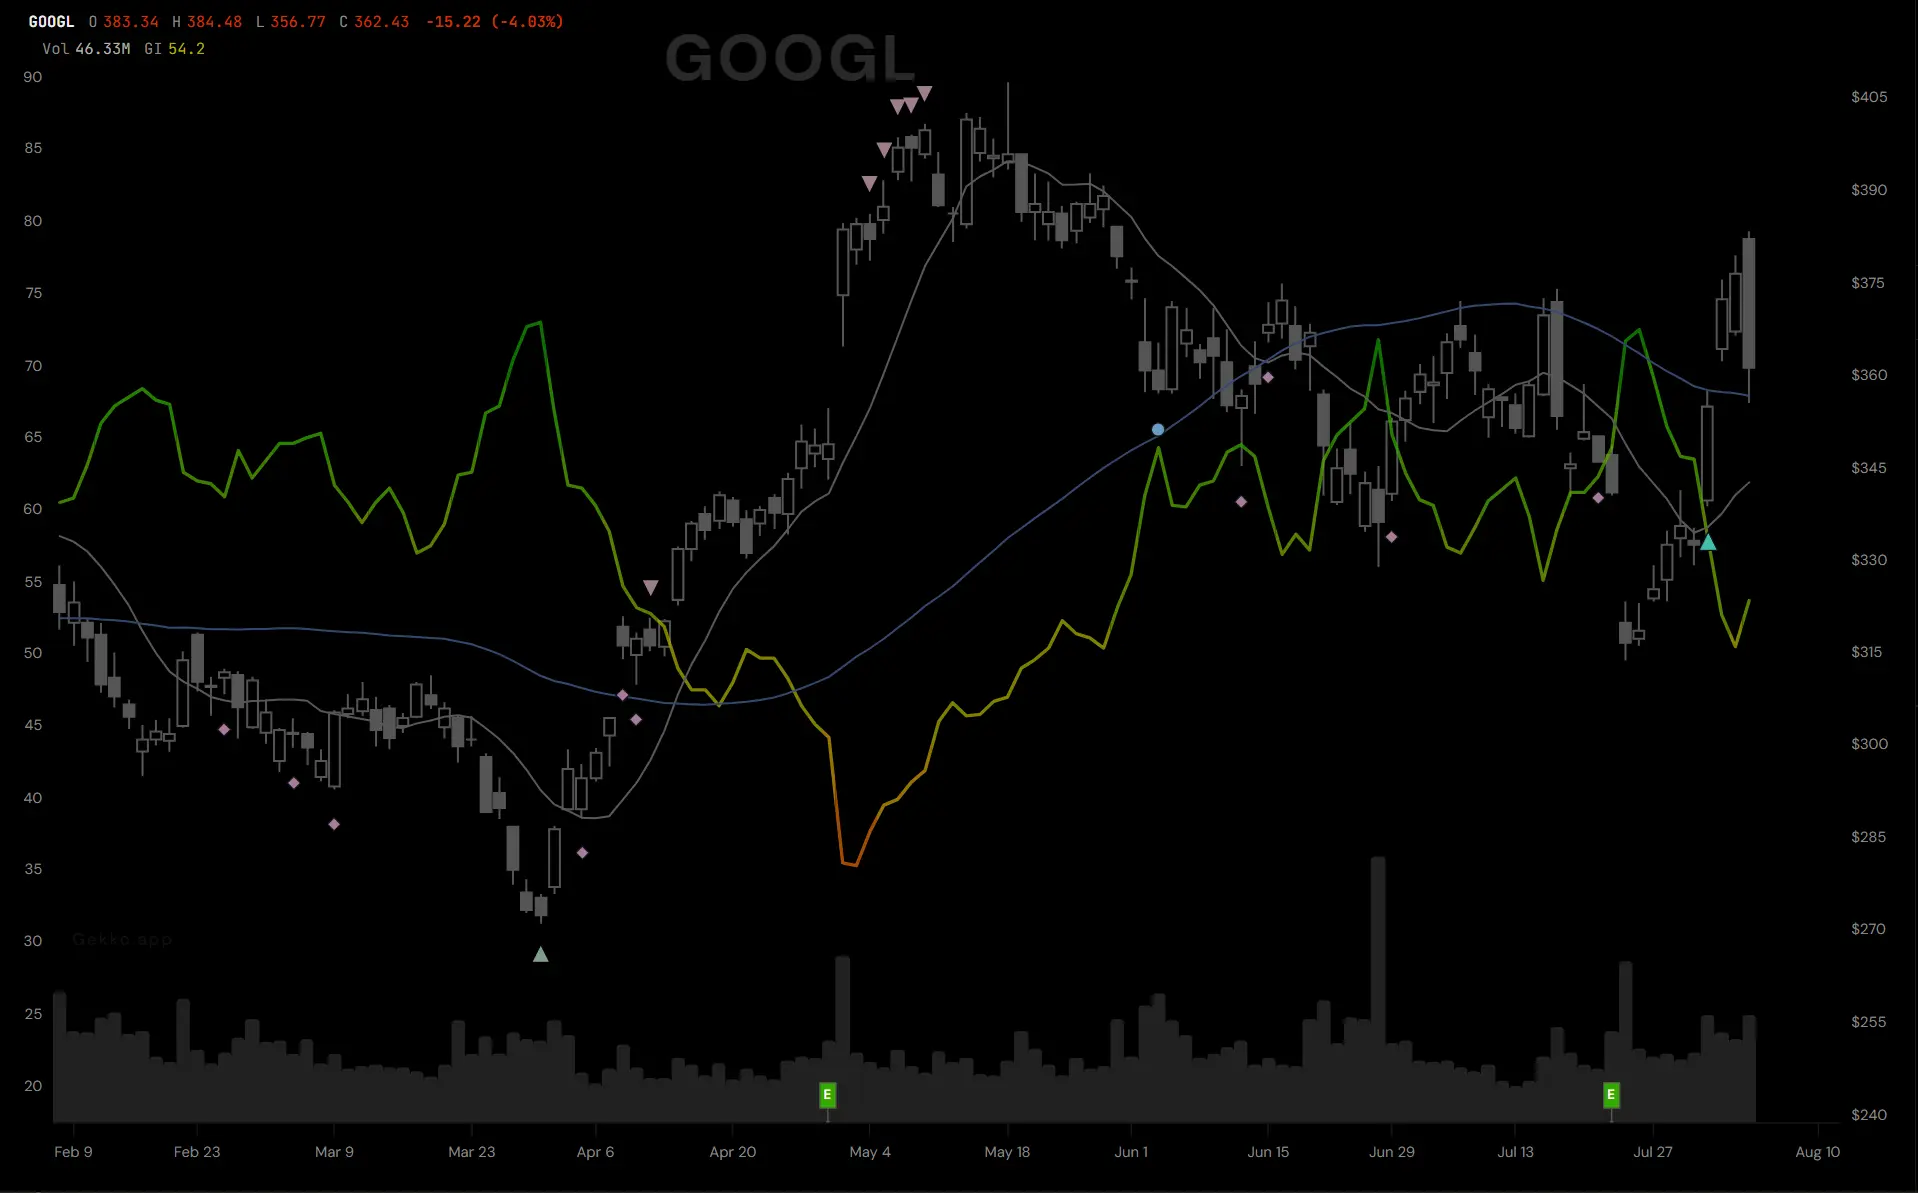
Every marker is clickable. Hover one to see who bought, how much, and on what date.
What the smart money tracker shows
Eight signal families, one chart
Insider buys, options flow, hedge fund quarterly changes, politician trades, buyback authorisations, volume thrusts, candle patterns and reversals. Each family has its own shape and colour, bullish markers sit below the bar and bearish above it, so direction reads before colour does.
Dated to the disclosure
A congressional trade can be reported up to 45 days after it happened. Gekko plots every filing on the day it became public — the day you could have acted on it — not the trade date.
The detail on hover
The contract, the premium, the filer, the size, the date. Toggle each layer on or off, add the GekkoIndex and seasonality overlays, switch between daily and weekly bars, and move between one month and five years of history.
Inside Gekko: the full chart
- Seven chart types — area, line, neon line, candlesticks, hollow candles, volume candles and Gekko's own TrendCandles™
- Moving averages with your own settings, drawing tools for trendlines and levels, and a layout that is remembered between visits
- The GekkoIndex gauge and zone track record beside the chart, with the trade planner and backtester in the same panel
- Alerts set straight from the chart on a price, a GekkoIndex reading or a Fair Value premium
- Company fundamentals, the AI news summary and the earnings calendar on the same page, so research never leaves the chart
How it appears on the free stock pages
Every Gekko stock page carries a one-year price chart with the 50-day and 200-day averages and volume, a small chart of the close against Gekko Fair Value, and a smart money summary: the latest insider purchases, congressional disclosures and a count of unusual options signals in the window. The chart with every signal plotted, the hover detail and the full tables are inside Gekko. See the NVIDIA page for an example.
Questions about smart money charts
Which signals are plotted on the chart?
Insider buys (open-market purchases from Form 4 filings), unusual options flow in four flavours, hedge fund quarterly position changes from 13F filings, congressional and Senate disclosures, buyback authorisations from SEC filings, volume thrusts, reversal candle patterns and price-exhaustion reversals. Each can be switched on or off.
Does it cover ETFs?
Yes — every US-listed stock and ETF Gekko covers, about 5,800 names. Some families only apply to stocks (insiders, buybacks); the options and fund layers cover ETFs too.
Is this real-time?
Prices update through the session and the GekkoIndex with them; filings and disclosures appear on the chart the day they become public. Gekko does not offer tick-by-tick real-time quotes.
See it on your own watchlist
Every feature, free for seven days — nothing to enter, nothing to cancel.
Start Your FREE 7 Day Trial → Every feature unlocked. No credit card required.