This has become part of my daily routine. Options flow right on the charts is something I actually look forward to checking. Hard to go back to piecing it together from three different sites.
Smart money leaves footprints
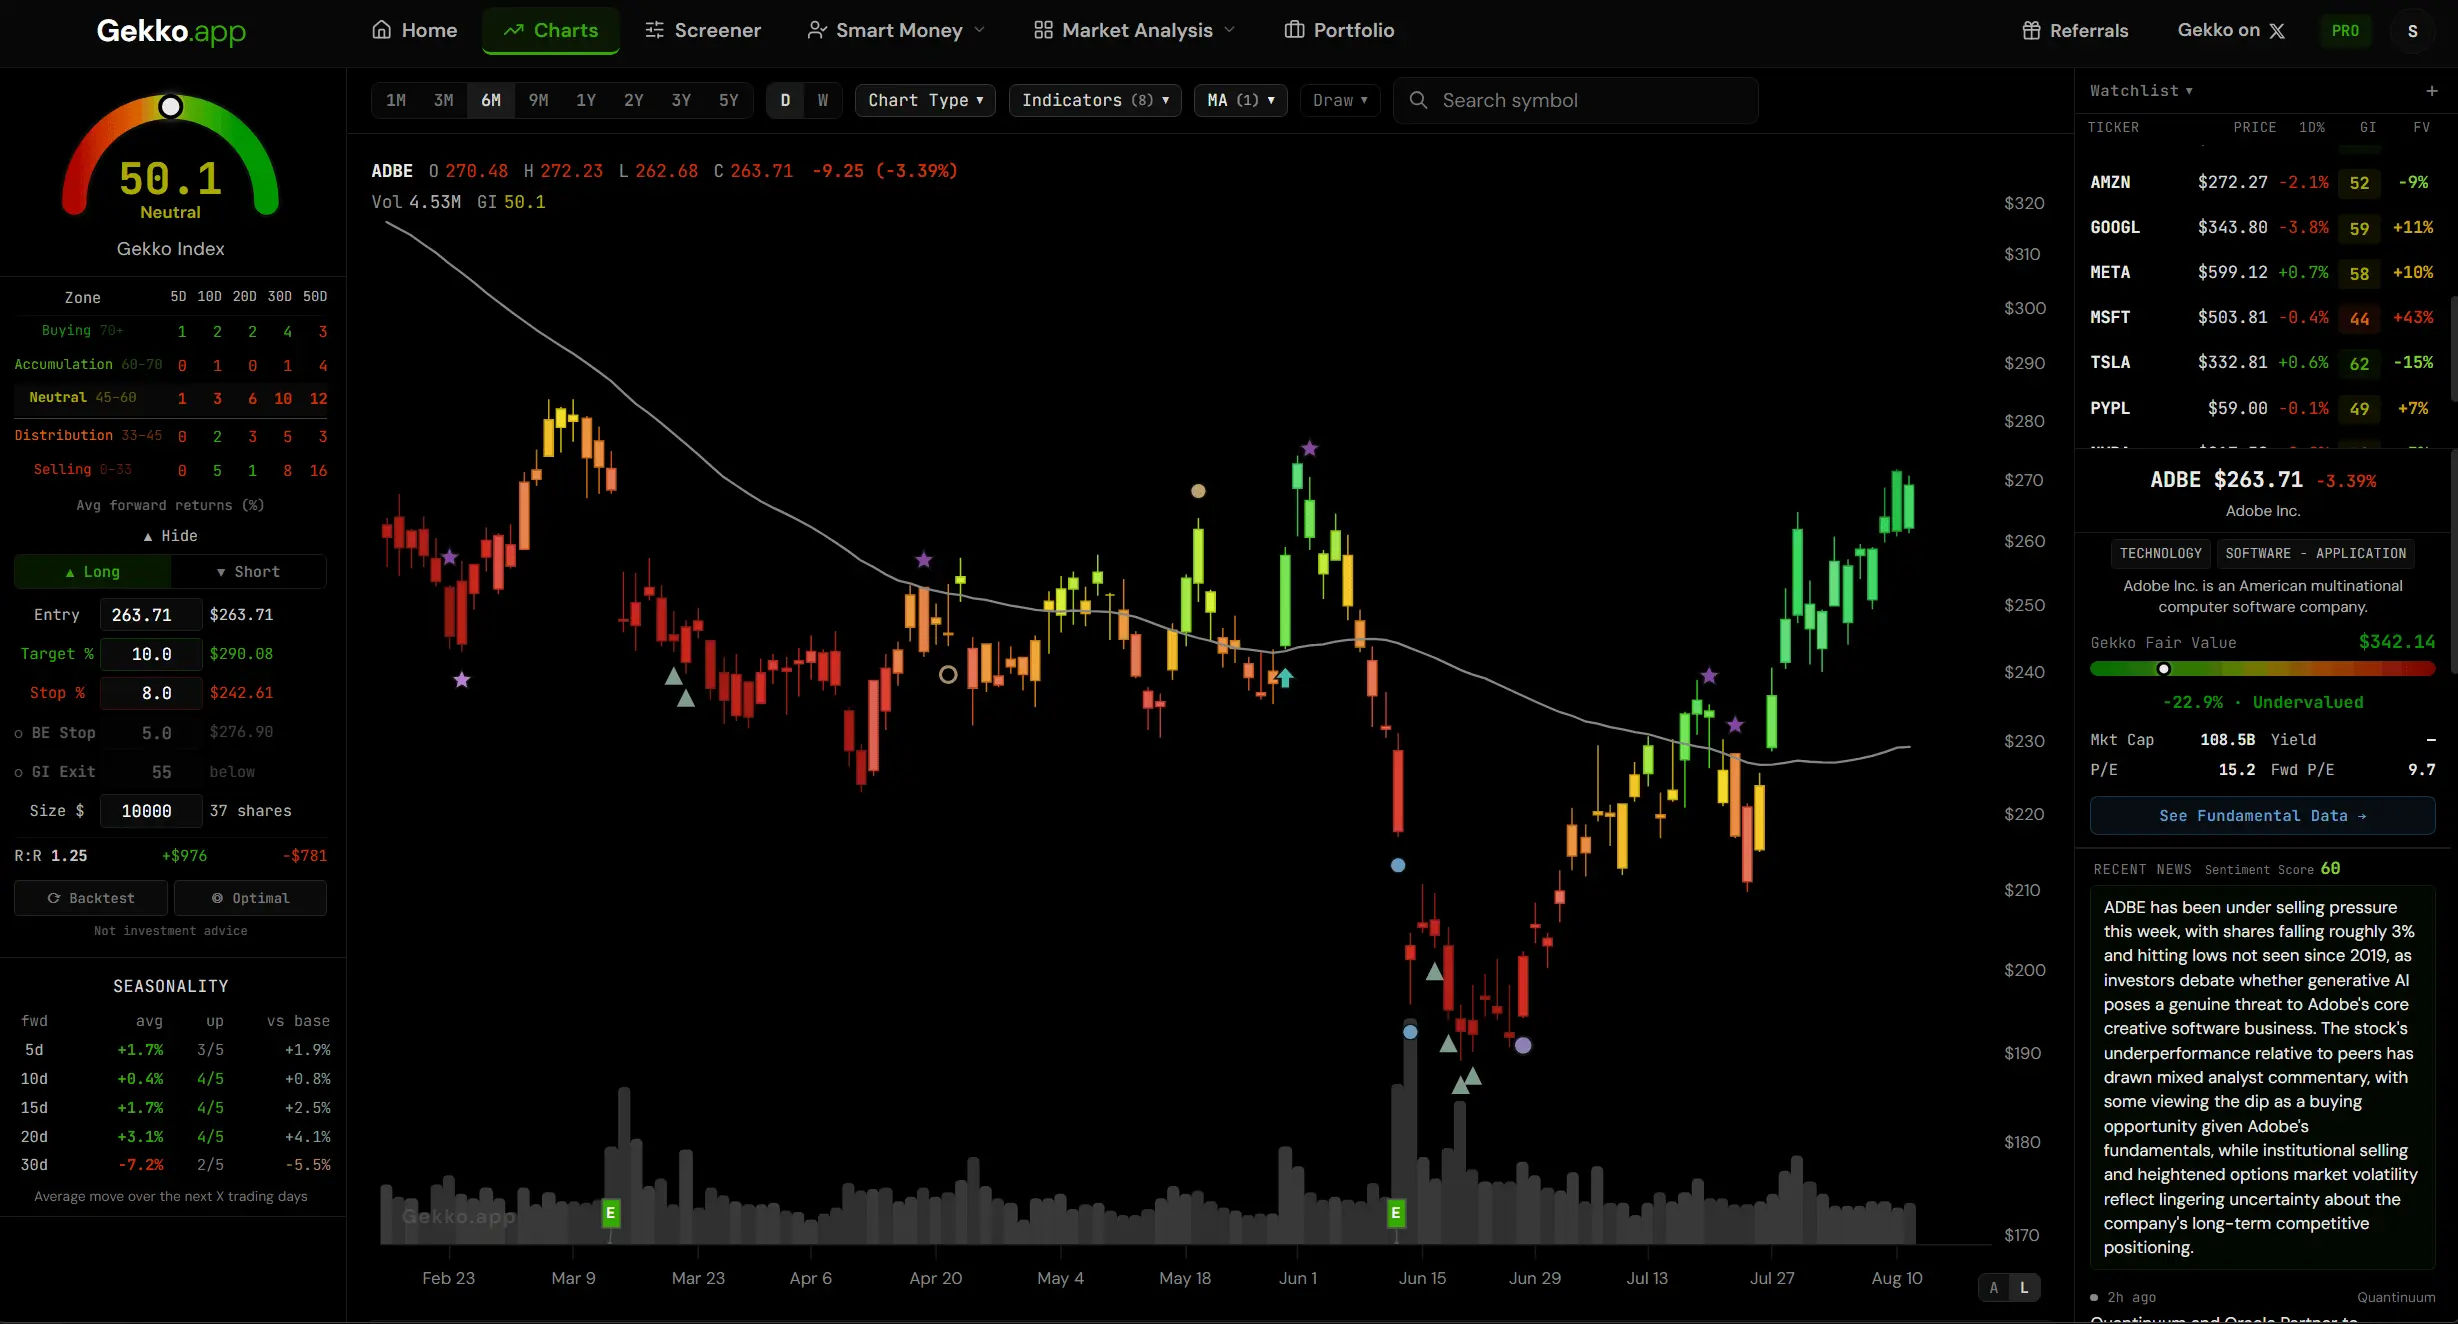
The stock analysis tool that shows you what smart money is doing — right on your chart
Insider buys, unusual options flow, politician and hedge fund trades — plotted directly on the price chart of any US stock or ETF. See who has been buying, and exactly when.
A stock research platform built for active swing traders and self-directed investors.
Join — other traders using Gekko
Start Your FREE 7 Day Trial →Every feature unlocked. No credit card required.
I searched for something that shows insider and institutional activity without a Bloomberg terminal. This gets closer than most. See smart money signals on the charts is what got me with Gekko. Highly recommended!!
I moved over from a couple of other platforms and haven't looked back. Having insider buys, options flow, and the index score visible on one chart cuts the noise way down. This one actually stuck.
Gekko is awesome for finding solid trade setups other tools don't do. Instead of checking multiple sites for filings and flow, most of it is already plotted. See the smart money buys and sells on charts is very handy to have thanks a lot for developing this.
I can tell gekko.app was developed by trading professionals with plenty of experience, I love how simple it is to use, better than expected for spotting institutional footprints. Mostly use the insider trades and options flow to spot opportunities.
Gekko tracks smart money data in one place better than anything else I've tried at this price. Options flow ranked by premium and direction is the first thing I open. Charts are fast and the whole thing just feels well thought out.
I open gekko every morning before the bell and honestly feel off if I skip it. Options flow feed plus the fair value number next to the index score gives me a quick filter that just works. One of the better tools I've added in a while.
Mainly here for the insider buy markers and volume thrust signals. Having them right on the price chart is more practical than reading separate tables. No real complaints after three weeks of daily use.
Like how the signals sit directly on the bars. No constant date cross-checking. Used the rotation and breadth tools a few times when the market got choppy. Straightforward product overall.
Does a clean job of putting smart money footprints on the chart where they belong. Buyback and politician trade markers are bonuses I didn't expect to use as often as I do. Genuinely useful.
This is a great app for swing trading which I'm into. The screener sorted by GekkoIndex has surfaced a few names I would have missed. Chart signals are clear. Being able to use the trade optimizer to set stops and profit targets is very useful.
I check the options flow and GekkoIndex first thing every session. Having both the score and the fair value estimate in the same place speeds everything up. This one earned a permanent spot in the morning lineup.
I replaced a couple of paid data services with this and haven't missed them. The combination of index score, flow, and insider markers covers most of what I was piecing together before. Reliable and actually enjoyable to use.
The historical view of what tends to happen after a stock enters the buying zone is one of the more interesting parts. Not a crystal ball, but useful context. Feels built by someone who actually trades and understands the workflow.
I've been using stock trading software for years and Gekko is different from anything else out there. Politician trade markers and buyback data turned out to be features I didn't know I needed. Occasional lag on the heatmaps during high-volume periods, otherwise solid.
Killer tool you guys developed!! Options flow and insider signals are the strongest parts. The rest of the tools are nice to have but seeing signals on charts does it for me.
Solid tool for tracking insider activity without constantly jumping between SEC filings and price charts. Signals are dated to the public disclosure, which is how it should be. Interface is clean once you settle on the layers you actually want visible every day.
The trade planner and backtester surprised me in a good way. Not trying to predict anything, just checking historical context around similar signals. Gekko.app has quietly become one of those tools I don't want to trade without.
What you guys developed is pretty unique. Fair value estimate next to the GekkoIndex is a nice touch. Caught a couple of accumulation setups earlier because of it. Only feedback I would say is the mobile version works okay but feels less smooth than desktop.
Daily dashboard summary is handy. Top GekkoIndex names and the live options flow give a quick read before I open individual charts. Haven't run into any major issues after six weeks.
Gekko does a good job organizing public data that used to be scattered everywhere. Mostly watch the accumulation and buying zones. Fair value estimate works as a secondary check.
Run the screener most mornings sorted by GekkoIndex and sector. A few names have shown up early enough to be useful. Chart overlays are clear and the hover details save time.
I enjoy using gekko regularly and use it to confirm whether there's any institutional footprint before sizing a position. Volume thrust and reversal markers have been more relevant than expected.
Good overall experience. Index score and fair value side by side make a quick filter. Options flow feed is well ranked. Would like a couple more dashboard customization options. I sent customer support and they responded it would be done soon.
Been using gekko for the chart signals and the daily brief. Nothing flashy, just well-organized data that used to take longer to put together. Fits my trading style cleanly.
This is my new go to trading tool. Insider and options data on the charts are the main draw. Screener works well. A few of the secondary tools feel less polished than the core features.
I log into Gekko everyday, new features seem to get added without extra cost, which is appreciated. Mostly live in the charts and the screener. Interface is straightforward once the layers are set the way I want them.
Good platform for the price! Chart signals are clear and the GekkoIndex zones give a quick read. Heatmaps and rotation tools are secondary for me but still helpful on quiet days.
I use gekko to stay aware of institutional activity without spending half the morning on filings. Options flow and the index are the two features I rely on most. Does the job without drama.
Gekko is practical and focused. Signals on the chart, a usable screener, and the fair value number are enough for my process. Gekko.app feels like it was put together for people who already do their own research rather than beginners looking for tips.
Useful for what it is. GekkoIndex is a decent starting point and the options data beats free alternatives. Layout gets crowded if you turn every signal layer on at the same time.
Does some things well, especially the chart markers for options and insiders. GekkoIndex still feels a bit like a black box and the screener could use more filter options. Still better than assembling the data myself from multiple sources every day.
Reviews submitted by Gekko subscribers. Individual experiences vary and are not indicative of future results.
What makes Gekko different
Every smart money signal on one stock chart
Everywhere else you hunt through separate tables for insider filings, options activity and congressional disclosures, then try to remember where the price was at the time. Gekko draws them straight onto your chart, on the day each one became public.
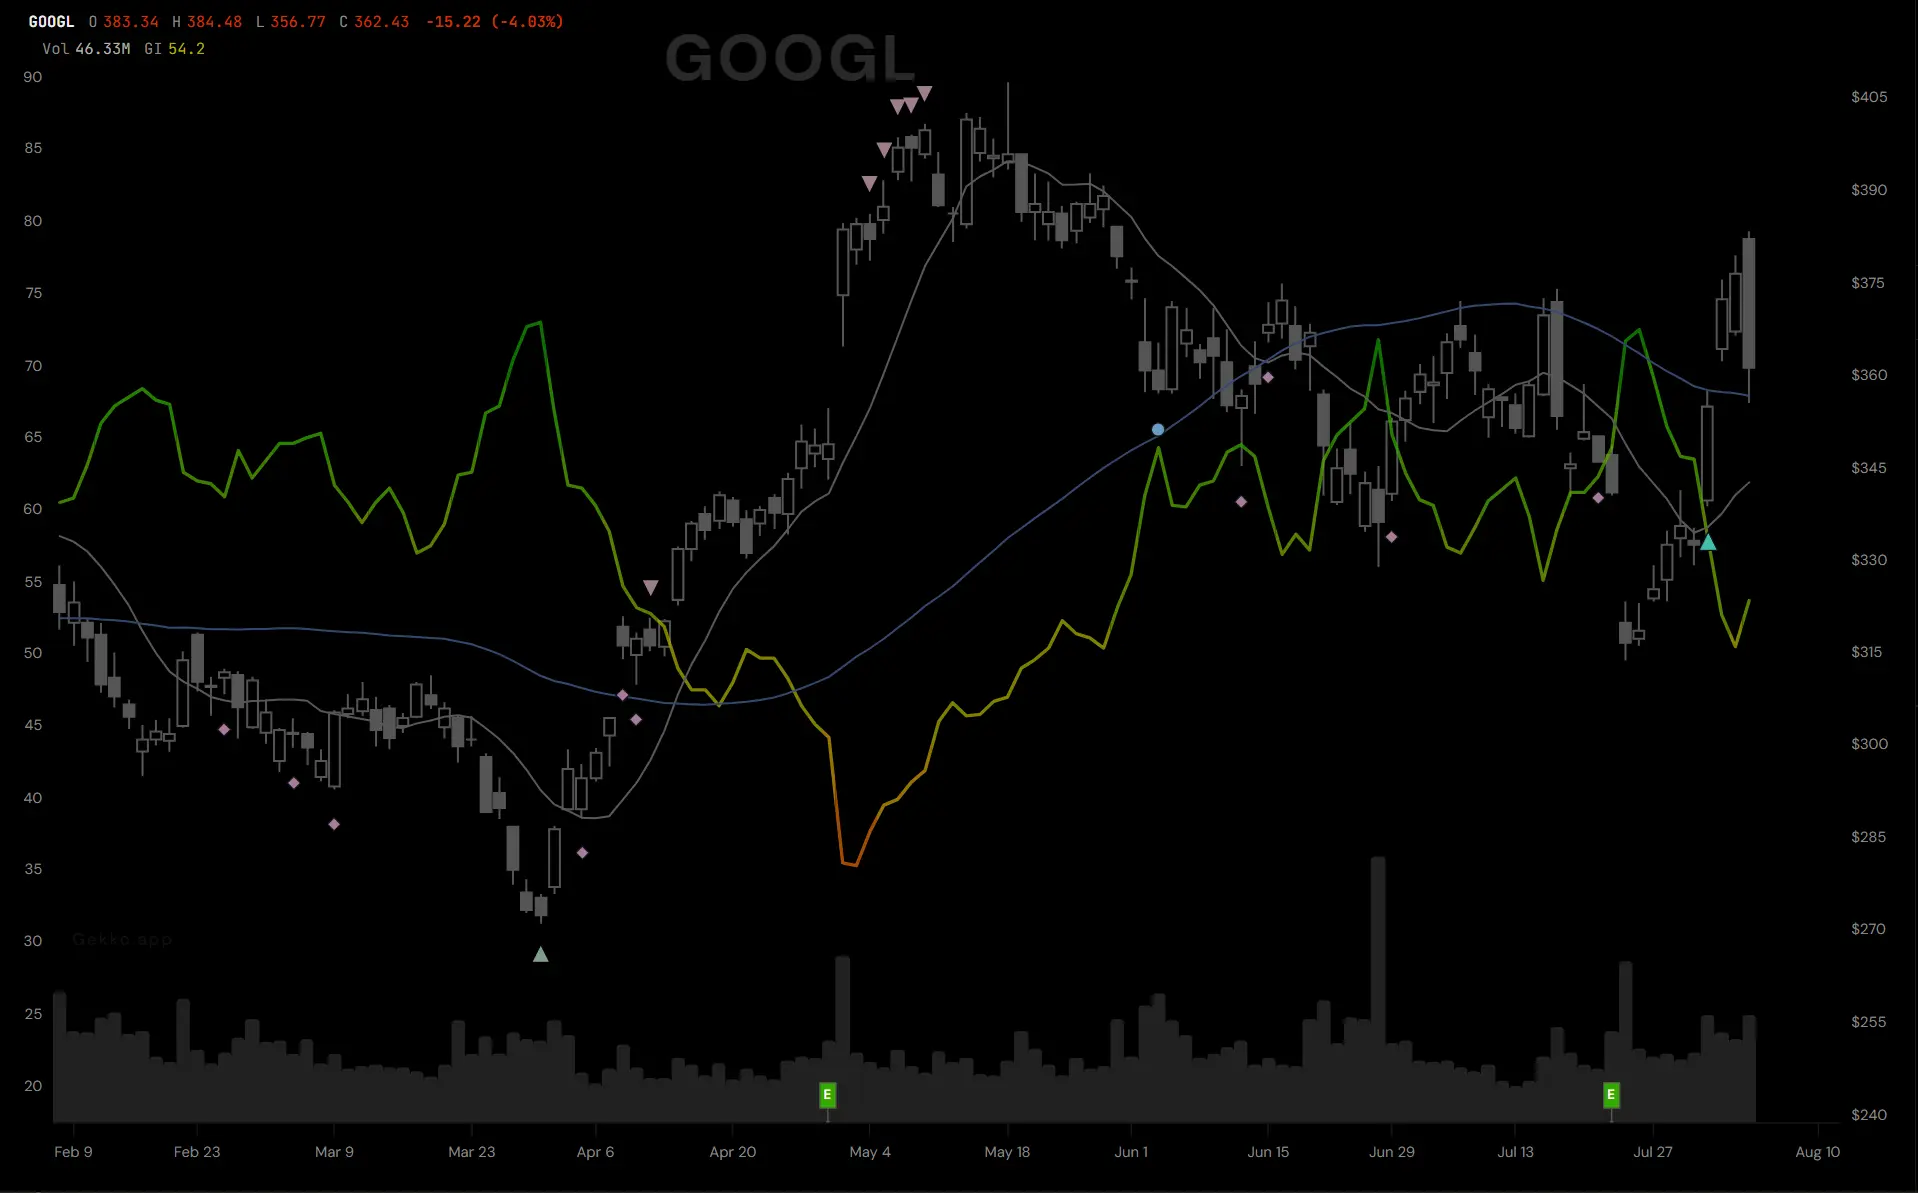
Every marker is clickable. Hover one to see who bought, how much, and on what date.
●
Insider buys
A CEO, CFO or 10% owner buying their own company's stock with their own money — the one trade nobody makes by accident.
●●
Options flow
Unusually large call and put positions, measured against the size of the company rather than a flat dollar figure — so mid-caps show up, not just the mega-caps.
■■
Hedge funds
What Buffett, Ackman, Coleman and ninety more did with the stock last quarter, from their 13F filings — one marker per quarter showing whether more of them were buying or selling, with the names on hover.
◆
Politician trades
Congressional and Senate disclosures, plotted on the day they became public — not the trade date, which can be up to 45 days earlier.
○
Buybacks
The company itself announcing it is buying back its own shares, pulled straight from the SEC filing.
↑↓
Volume thrusts
A forceful one-day move on heavy volume, closing near its own extreme, arriving after the stock has been beaten down or run up.
★★
Candle patterns
Hammers, engulfing bars, kickers and morning and evening stars — the reversal candles worth knowing, filtered by where they printed and by the GekkoIndex so you only see the ones that matter.
▲▼
Reversals
Price exhaustion after a run of consecutive new highs or new lows — a marker for where a move ran out of road.
Built to be read at a glance
Position tells you direction before colour does. Bullish markers sit below the bar, bearish above it — you can read the chart before you have processed a single colour.
Hover any marker for the detail behind it: the contract, the size, the date. Toggle each layer on or off, draw your own trendlines and levels, switch between daily and weekly bars, and move between one month and five years of history.
Every marker family owns its own shape and its own place in the stack, so the chart stays readable even when several land on the same day.
More about smart money charts →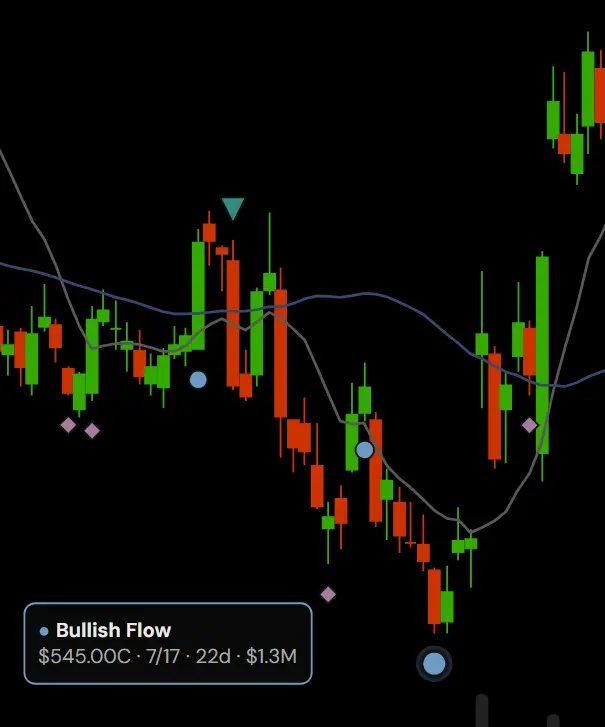
Our flagship indicator
One score for the whole smart money picture
The GekkoIndex™ is a 0–100 score on every stock and ETF, updated through the trading day. It takes the institutional footprints scattered across filings, flow and price behaviour and turns them into one number you can read at a glance — the anchor the rest of Gekko is built around.
Sort the market by it, filter by it, plot it over price, and check how a stock has historically behaved after entering each zone — 5, 10, 20, 30 and 50 trading days out.
Read the GekkoIndex™ whitepaper → More about the GekkoIndex™ →
GekkoIndex™ Zones
BuyingSmart money likely accumulating heavily
AccumulationInstitutional interest building
NeutralNo clear directional signal
DistributionInstitutions potentially offloading
SellingSmart money likely exiting positions
What's inside
The rest of the toolkit
Every feature is included in the trial and in both plans. Each one has its own page.
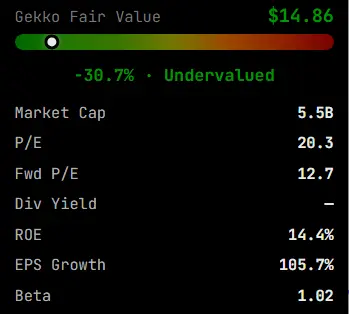
Gekko Fair Value
A single estimate of what a stock is worth, on every ticker, with the gap to the price and its 12-month trend.
Learn more →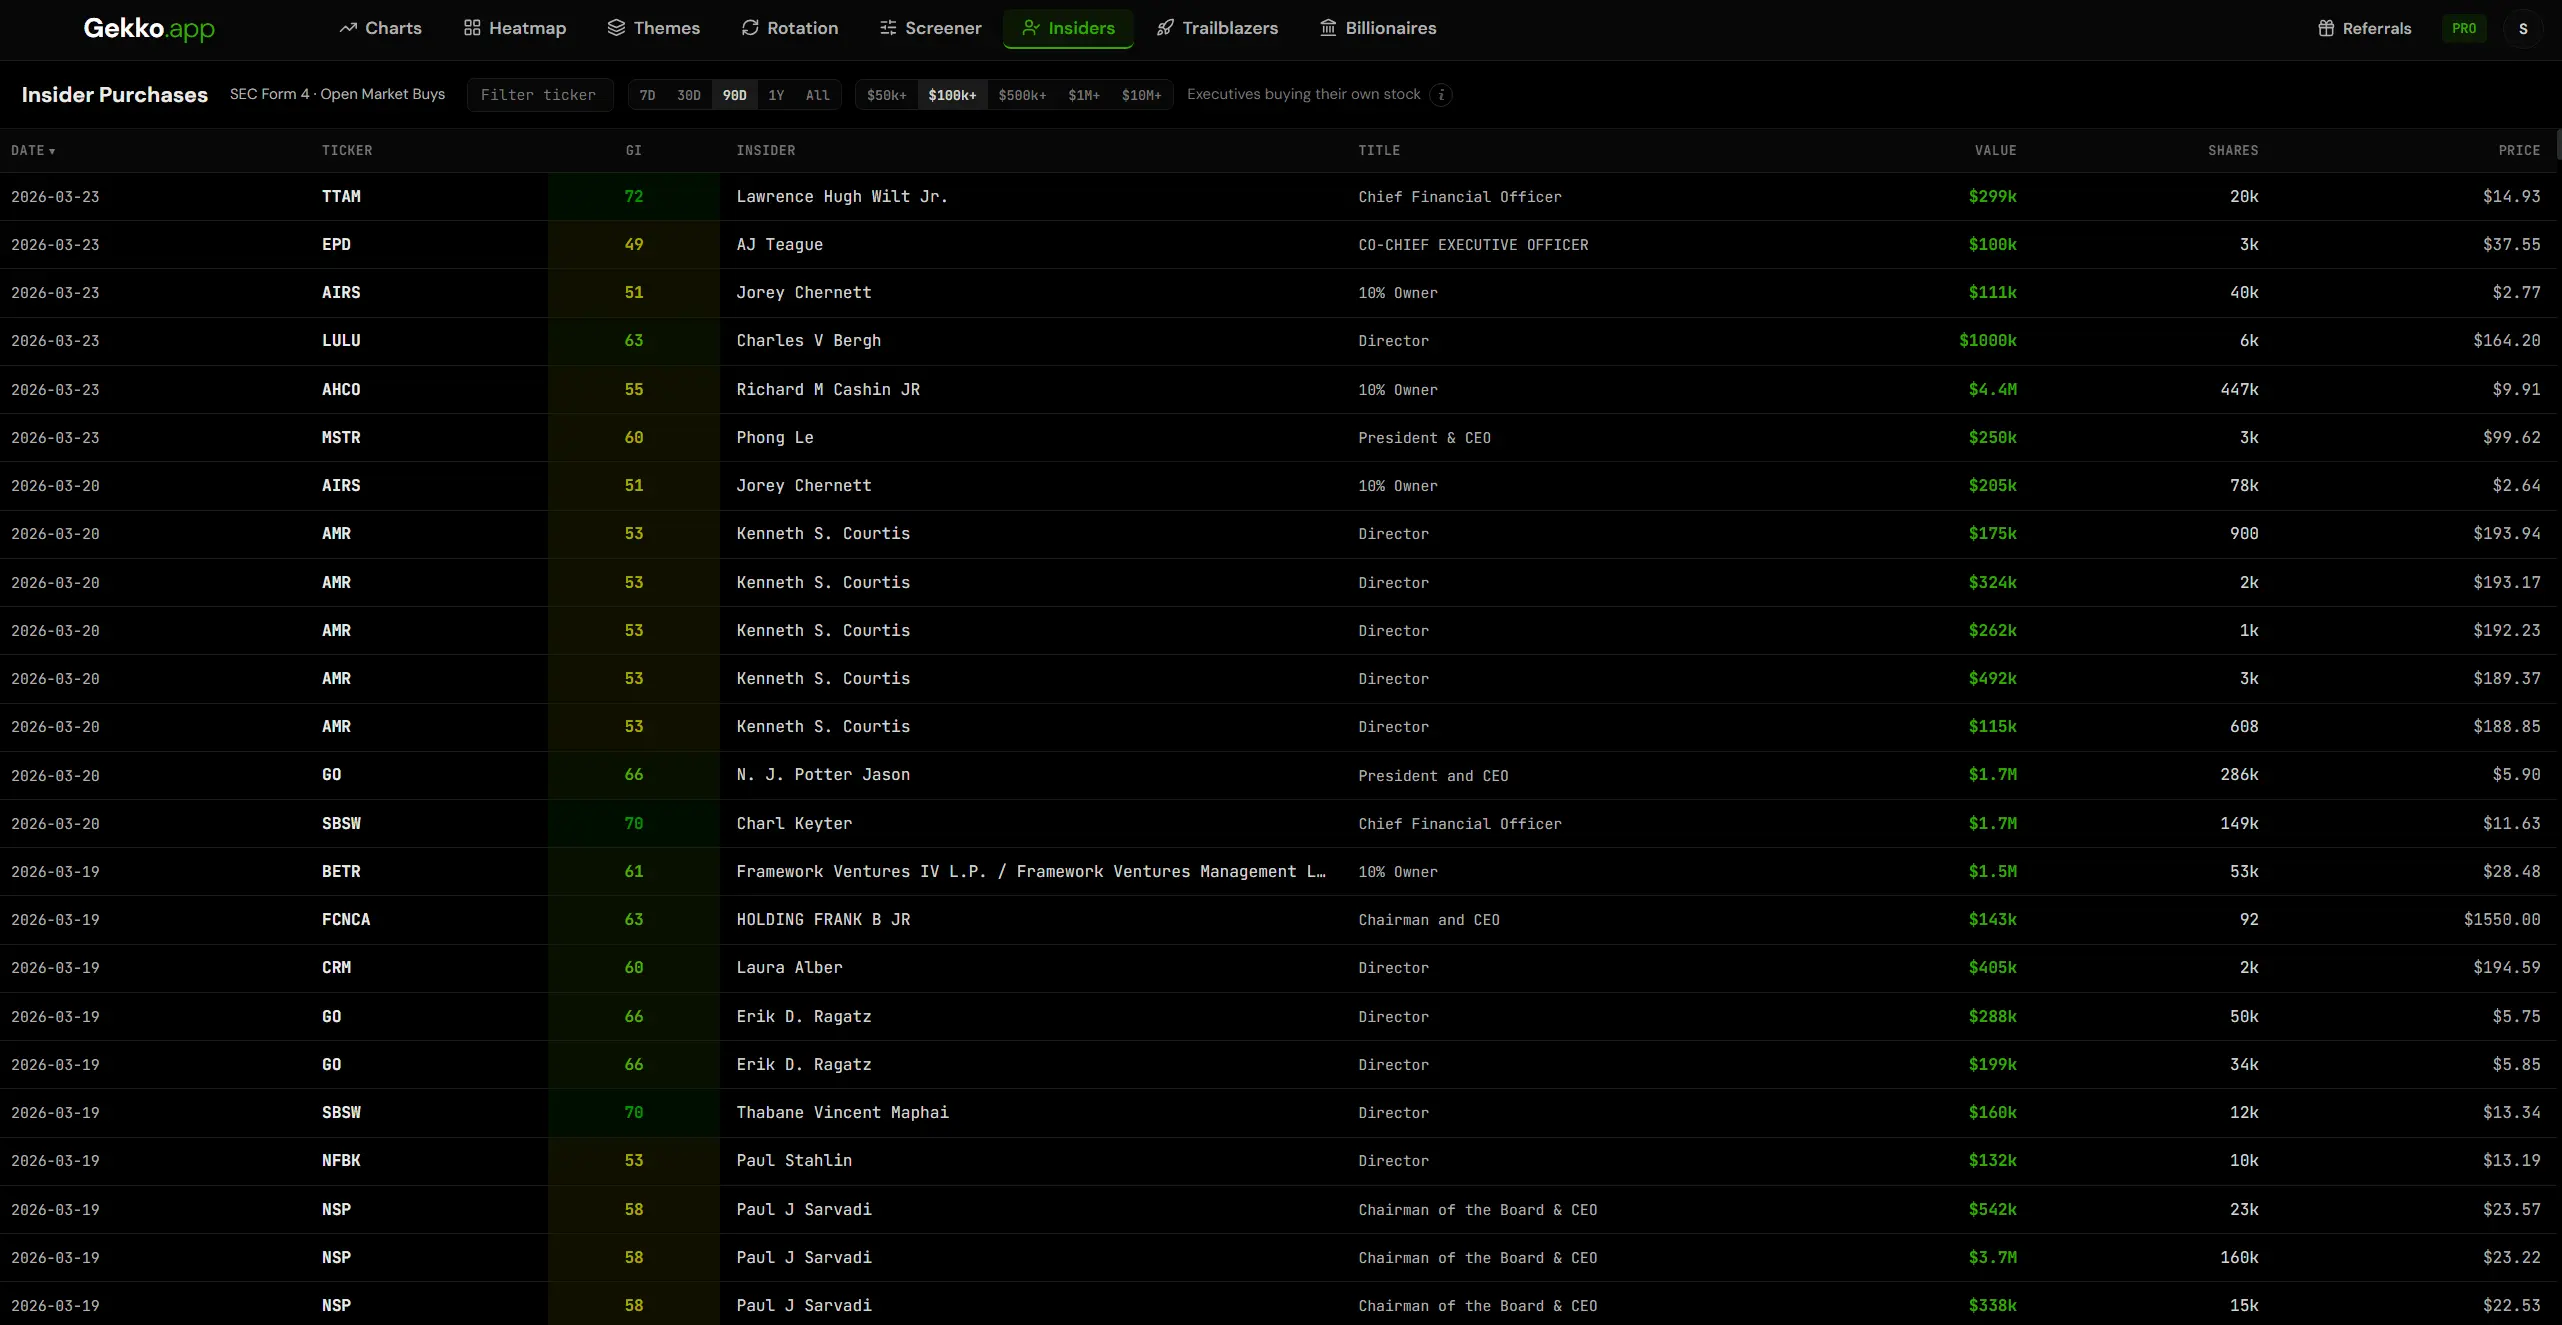
Insider trading tracker
Open-market purchases by executives and 10% owners from Form 4 filings, on the chart and in a live feed.
Learn more →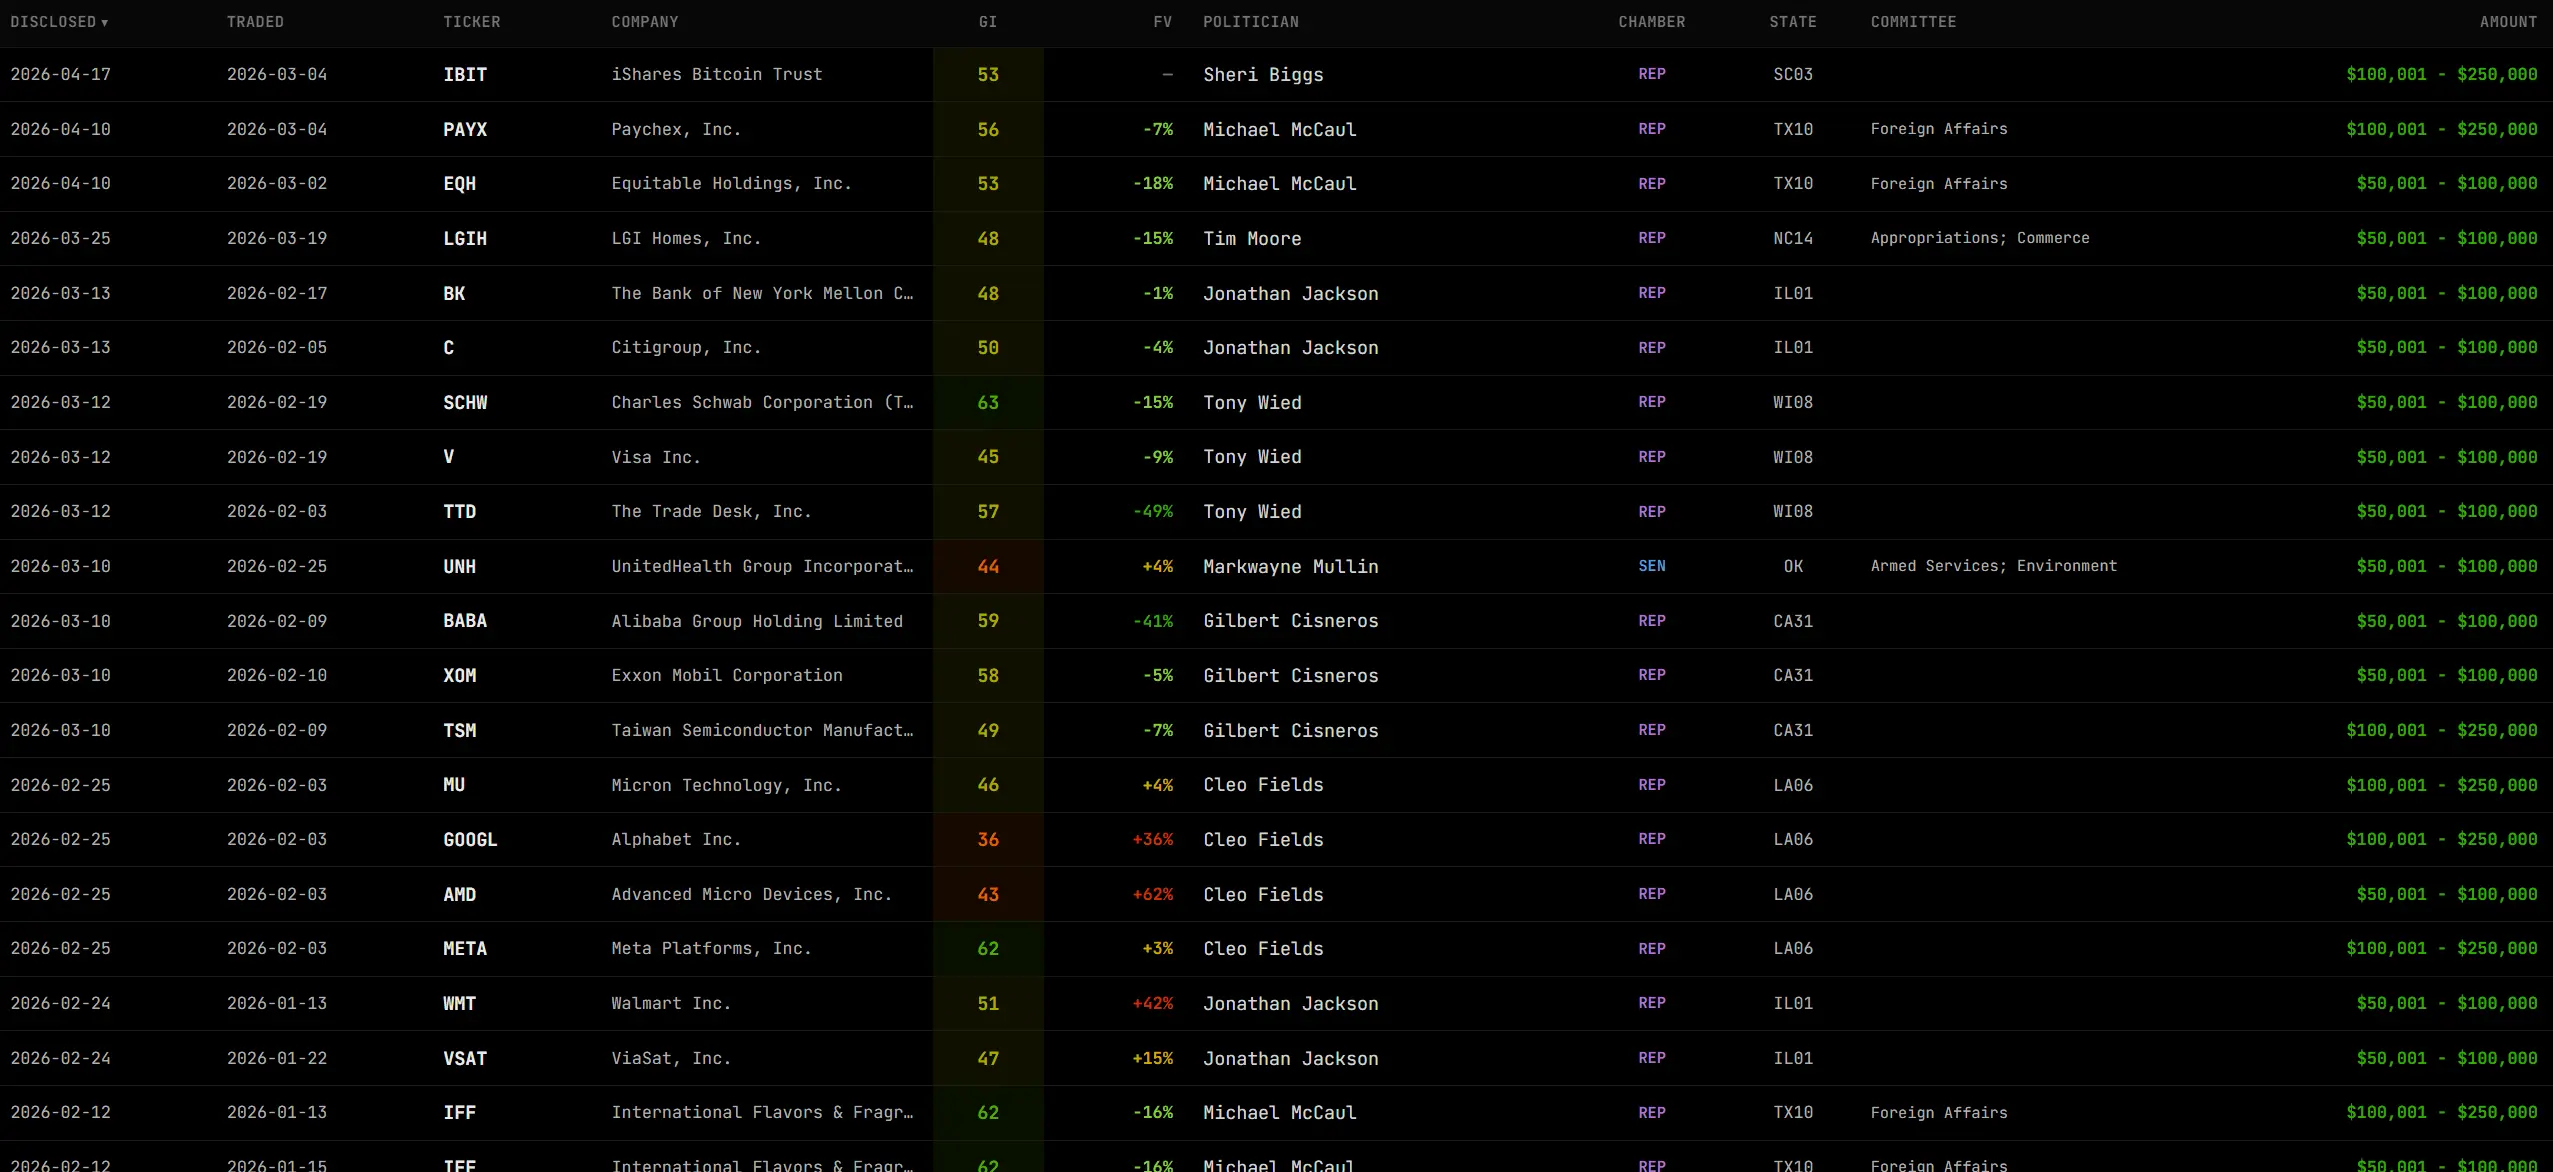
Congress trading tracker
House and Senate disclosures dated to the day they became public, with the member, chamber and amount range.
Learn more →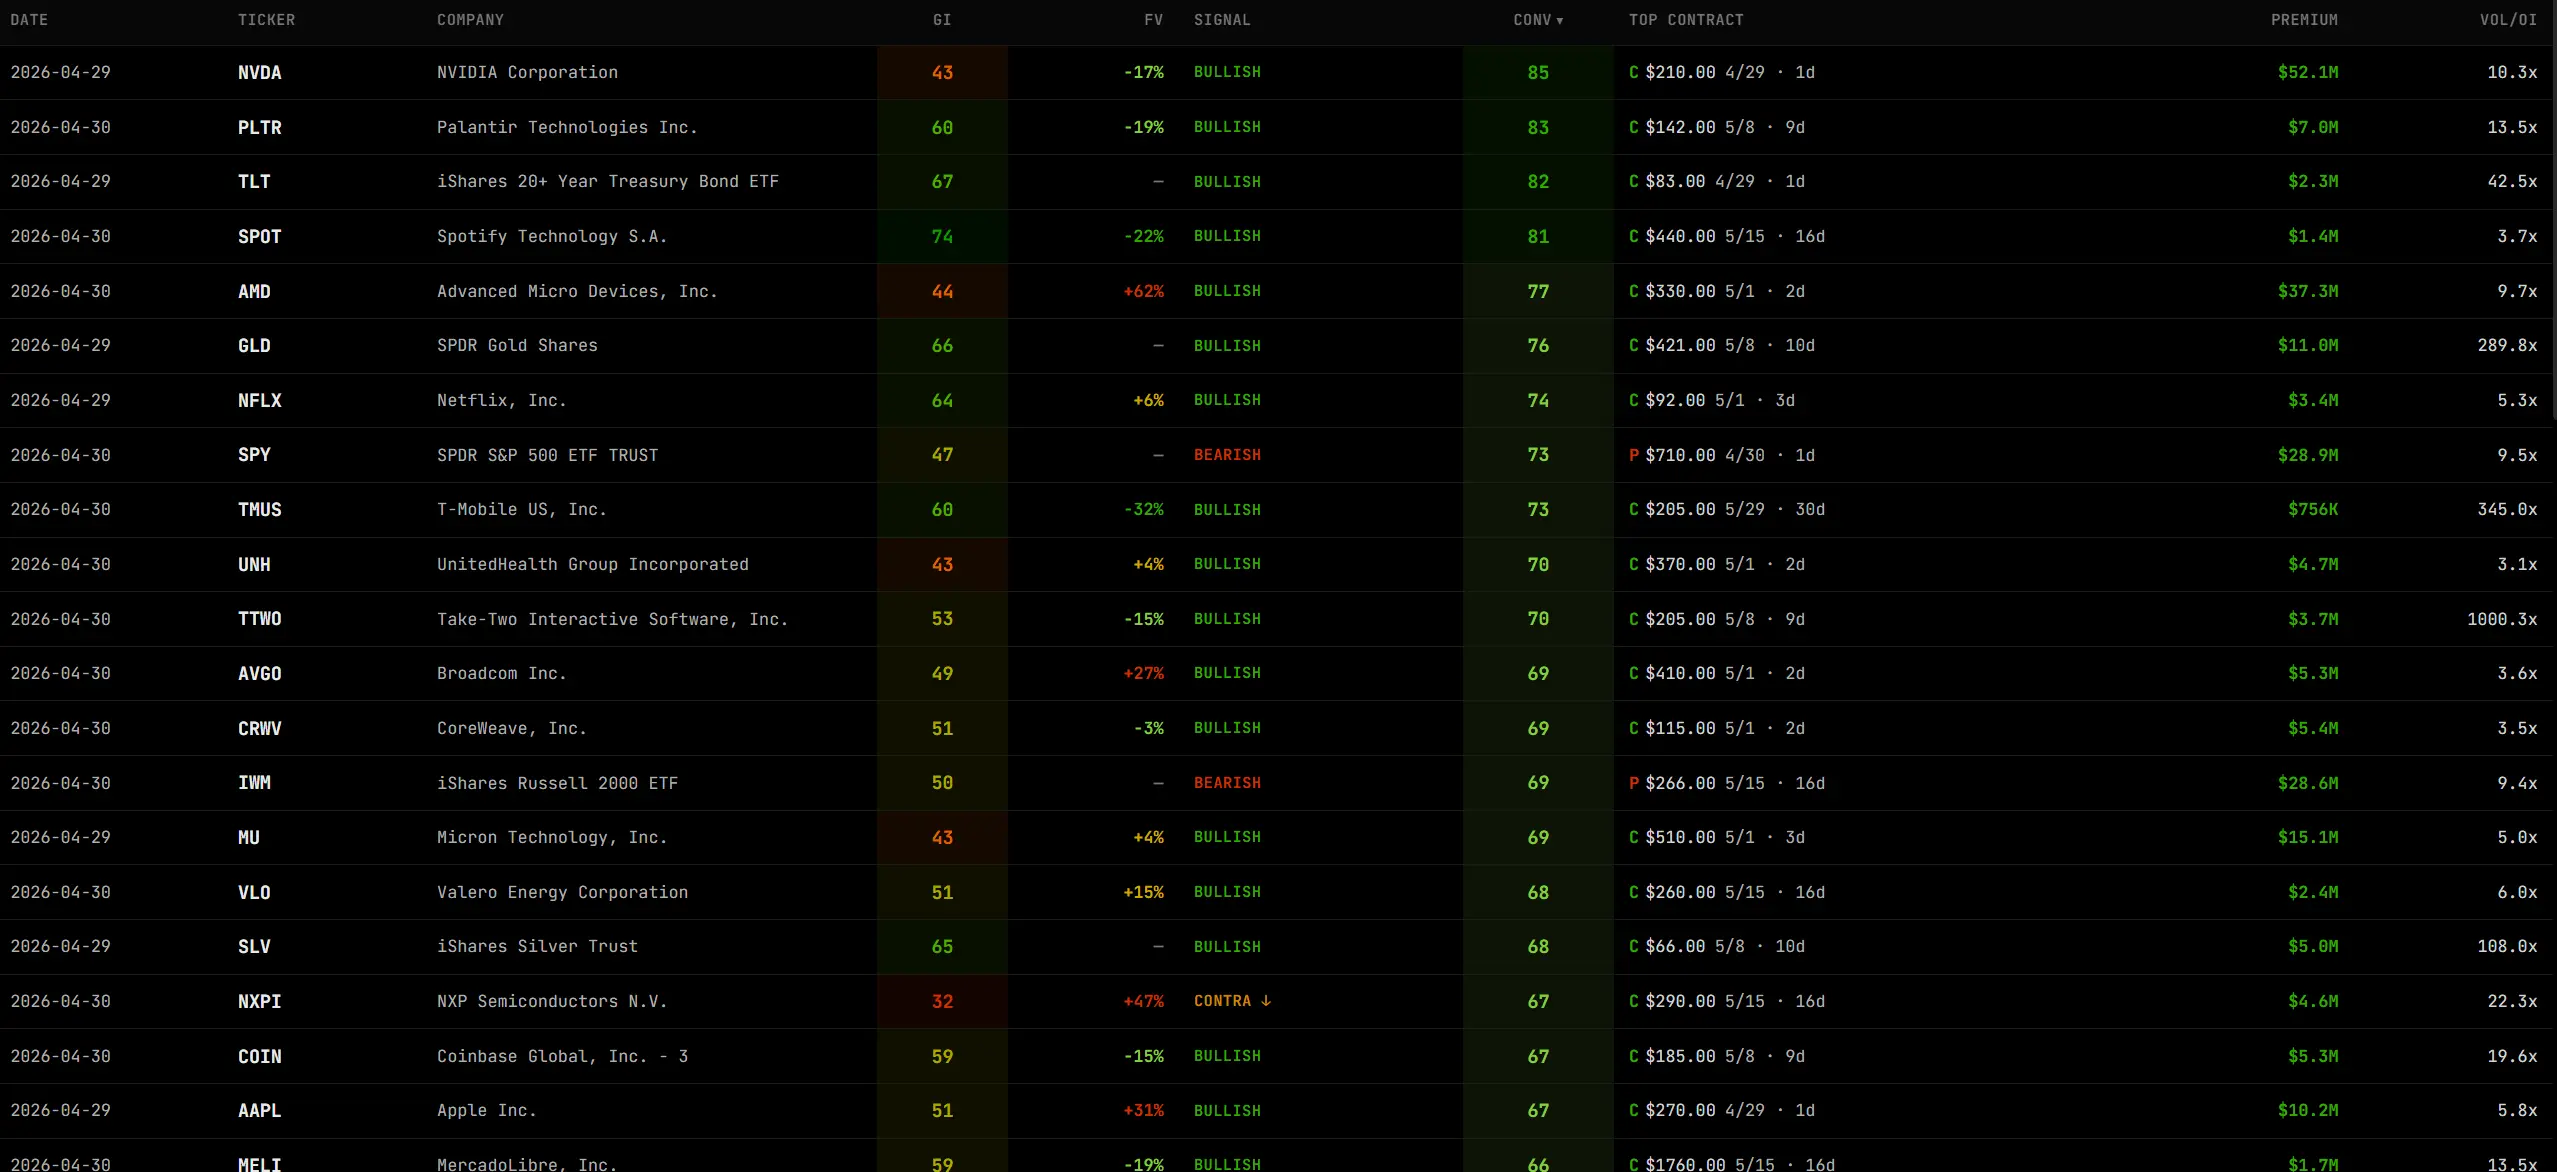
Unusual options activity
The big bets, ranked daily: contract, premium, volume against open interest, bullish or bearish.
Learn more →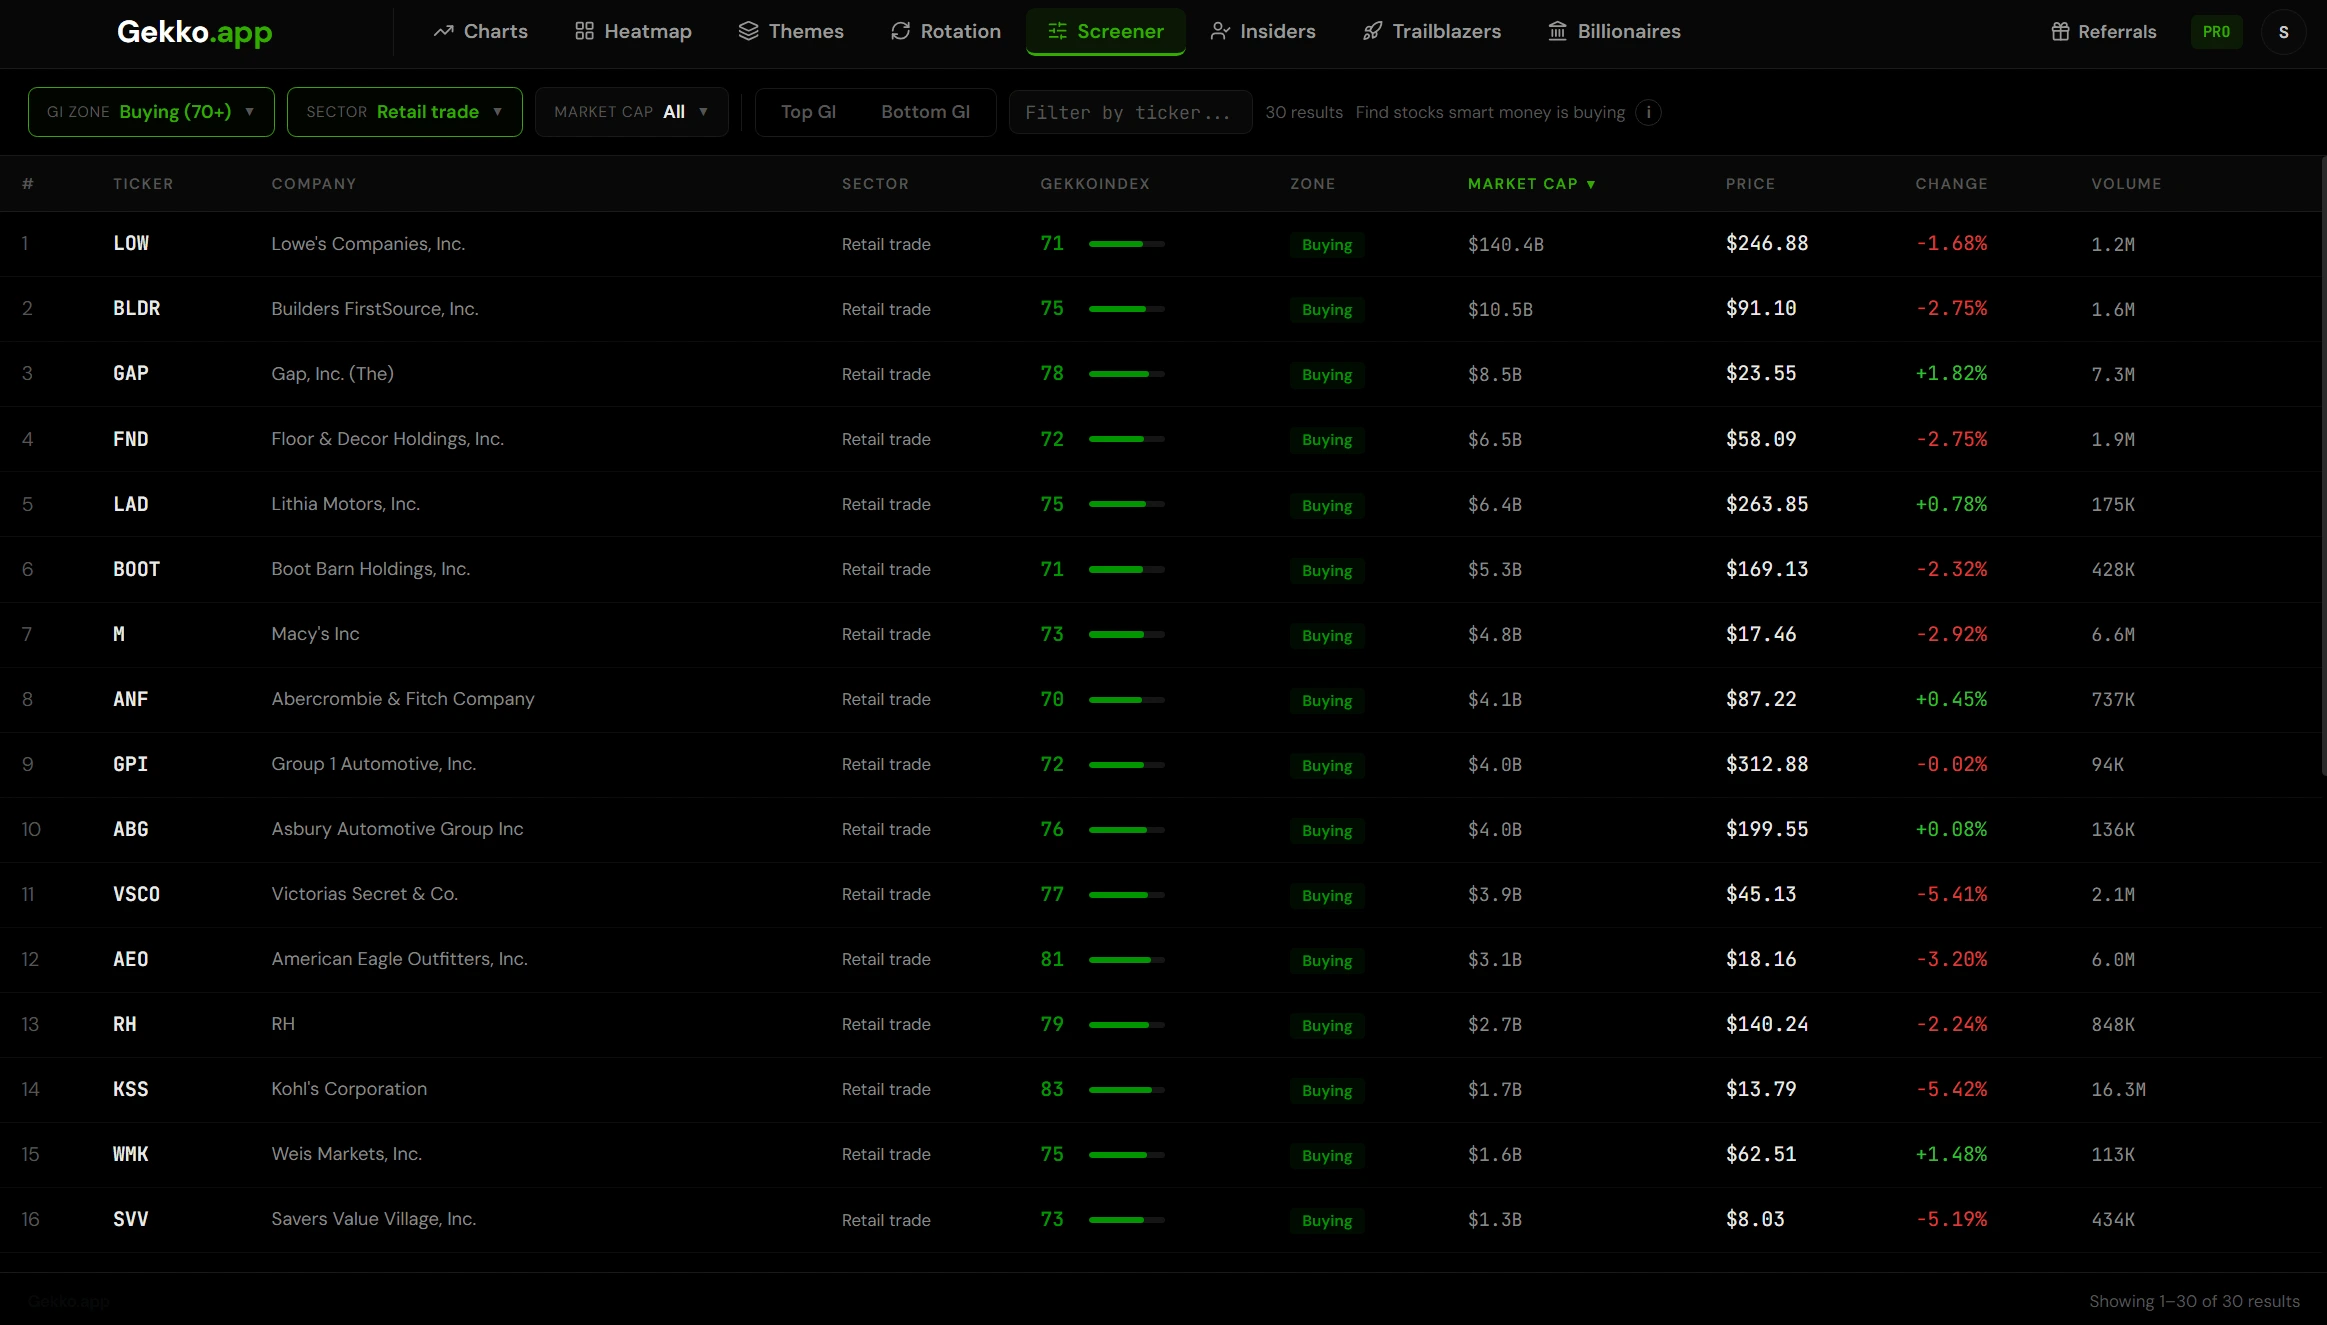
Stock screener
All 5,800 US stocks and ETFs ranked by GekkoIndex, narrowed by zone, sector, industry or market cap.
Learn more →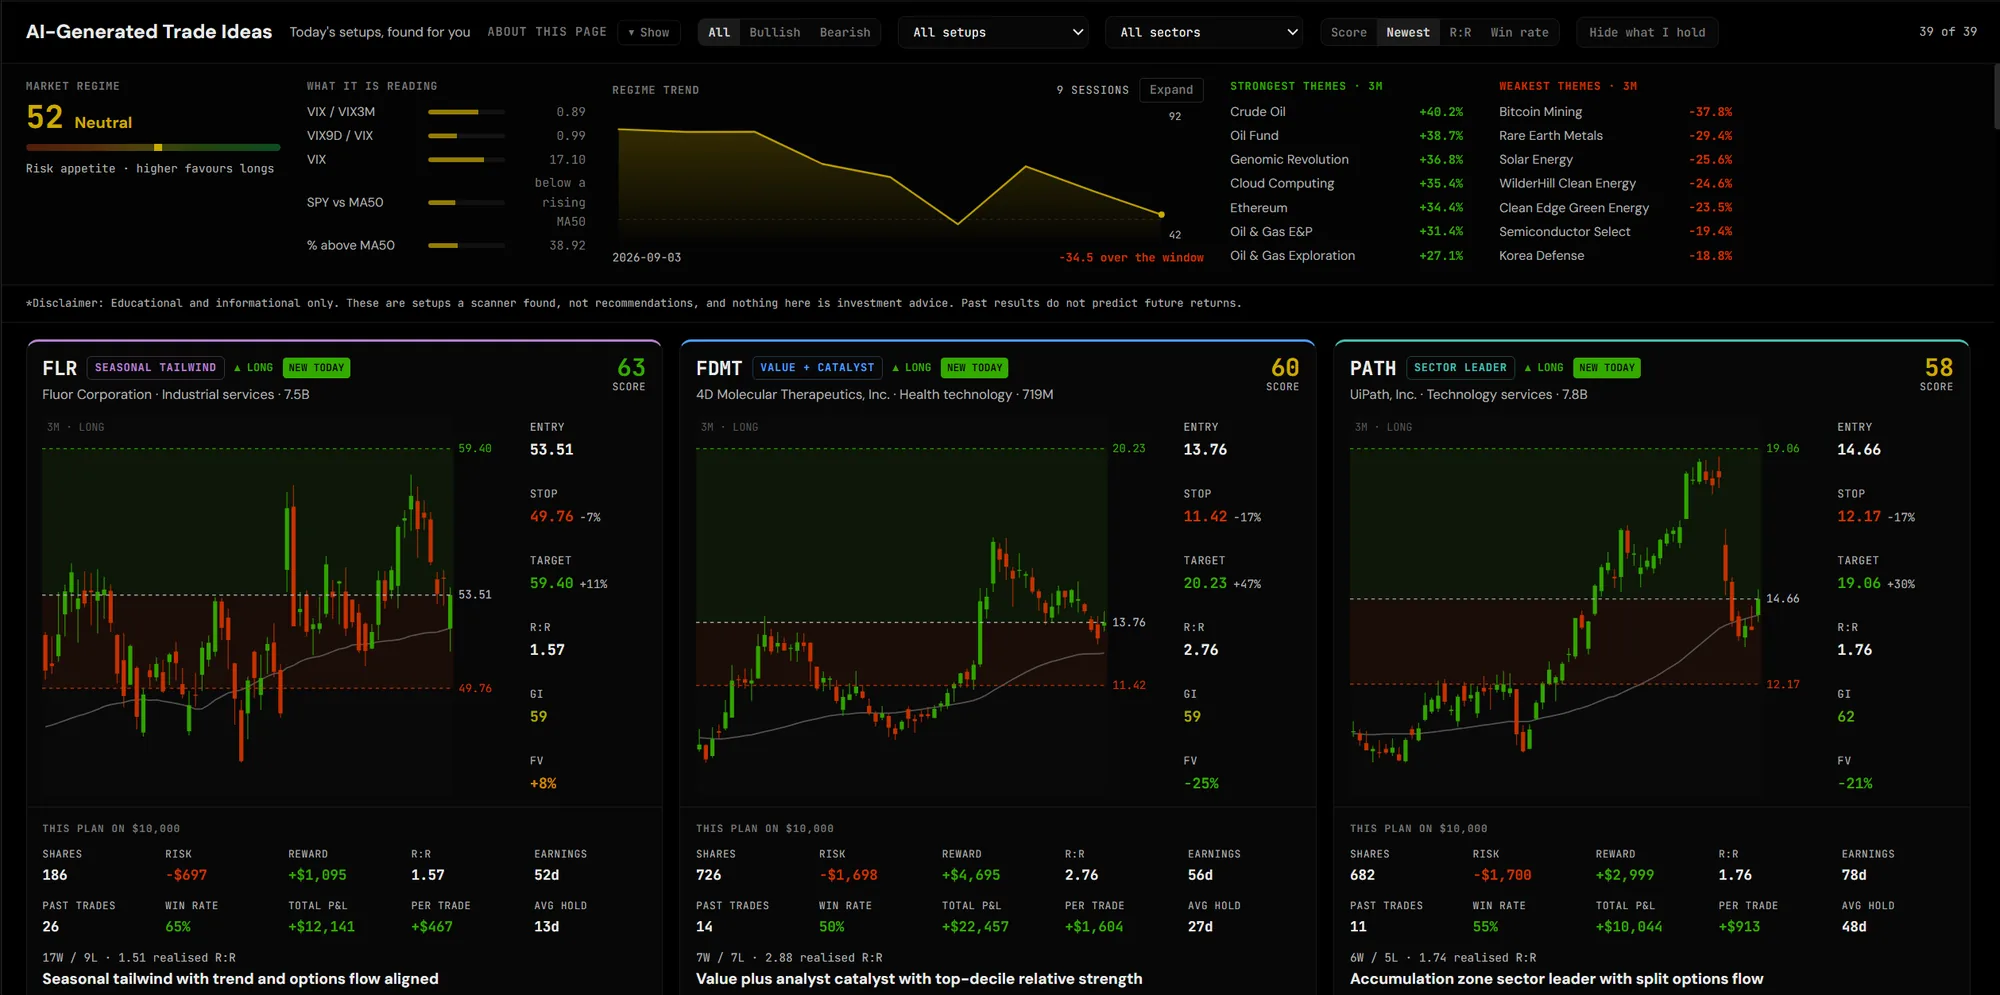
AI trade ideas
A fresh board of trade ideas every morning, each with backtested entry, stop and target levels.
Learn more →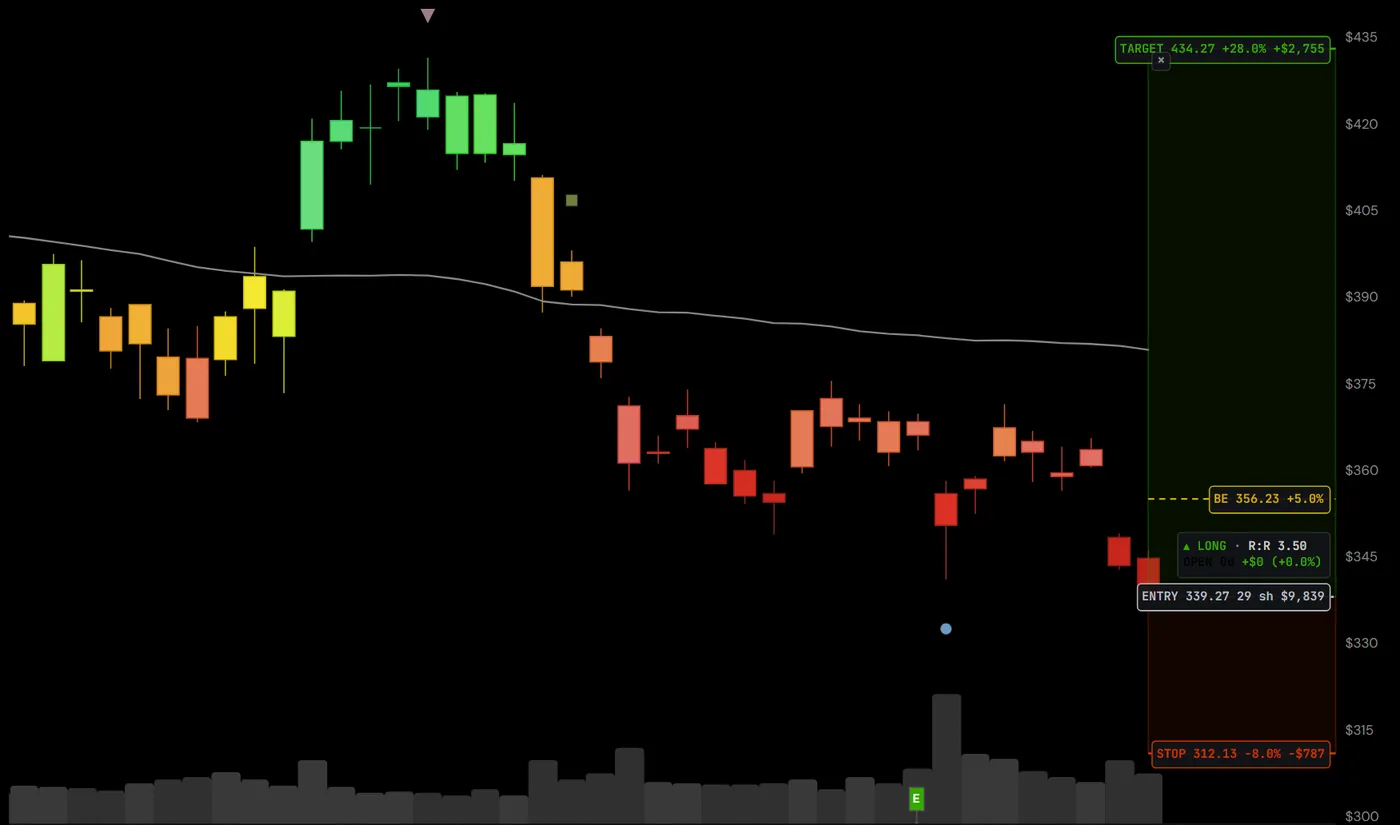
Real-time alerts
Price, GekkoIndex or Fair Value triggers set straight from the chart, checked every fifteen minutes.
Learn more →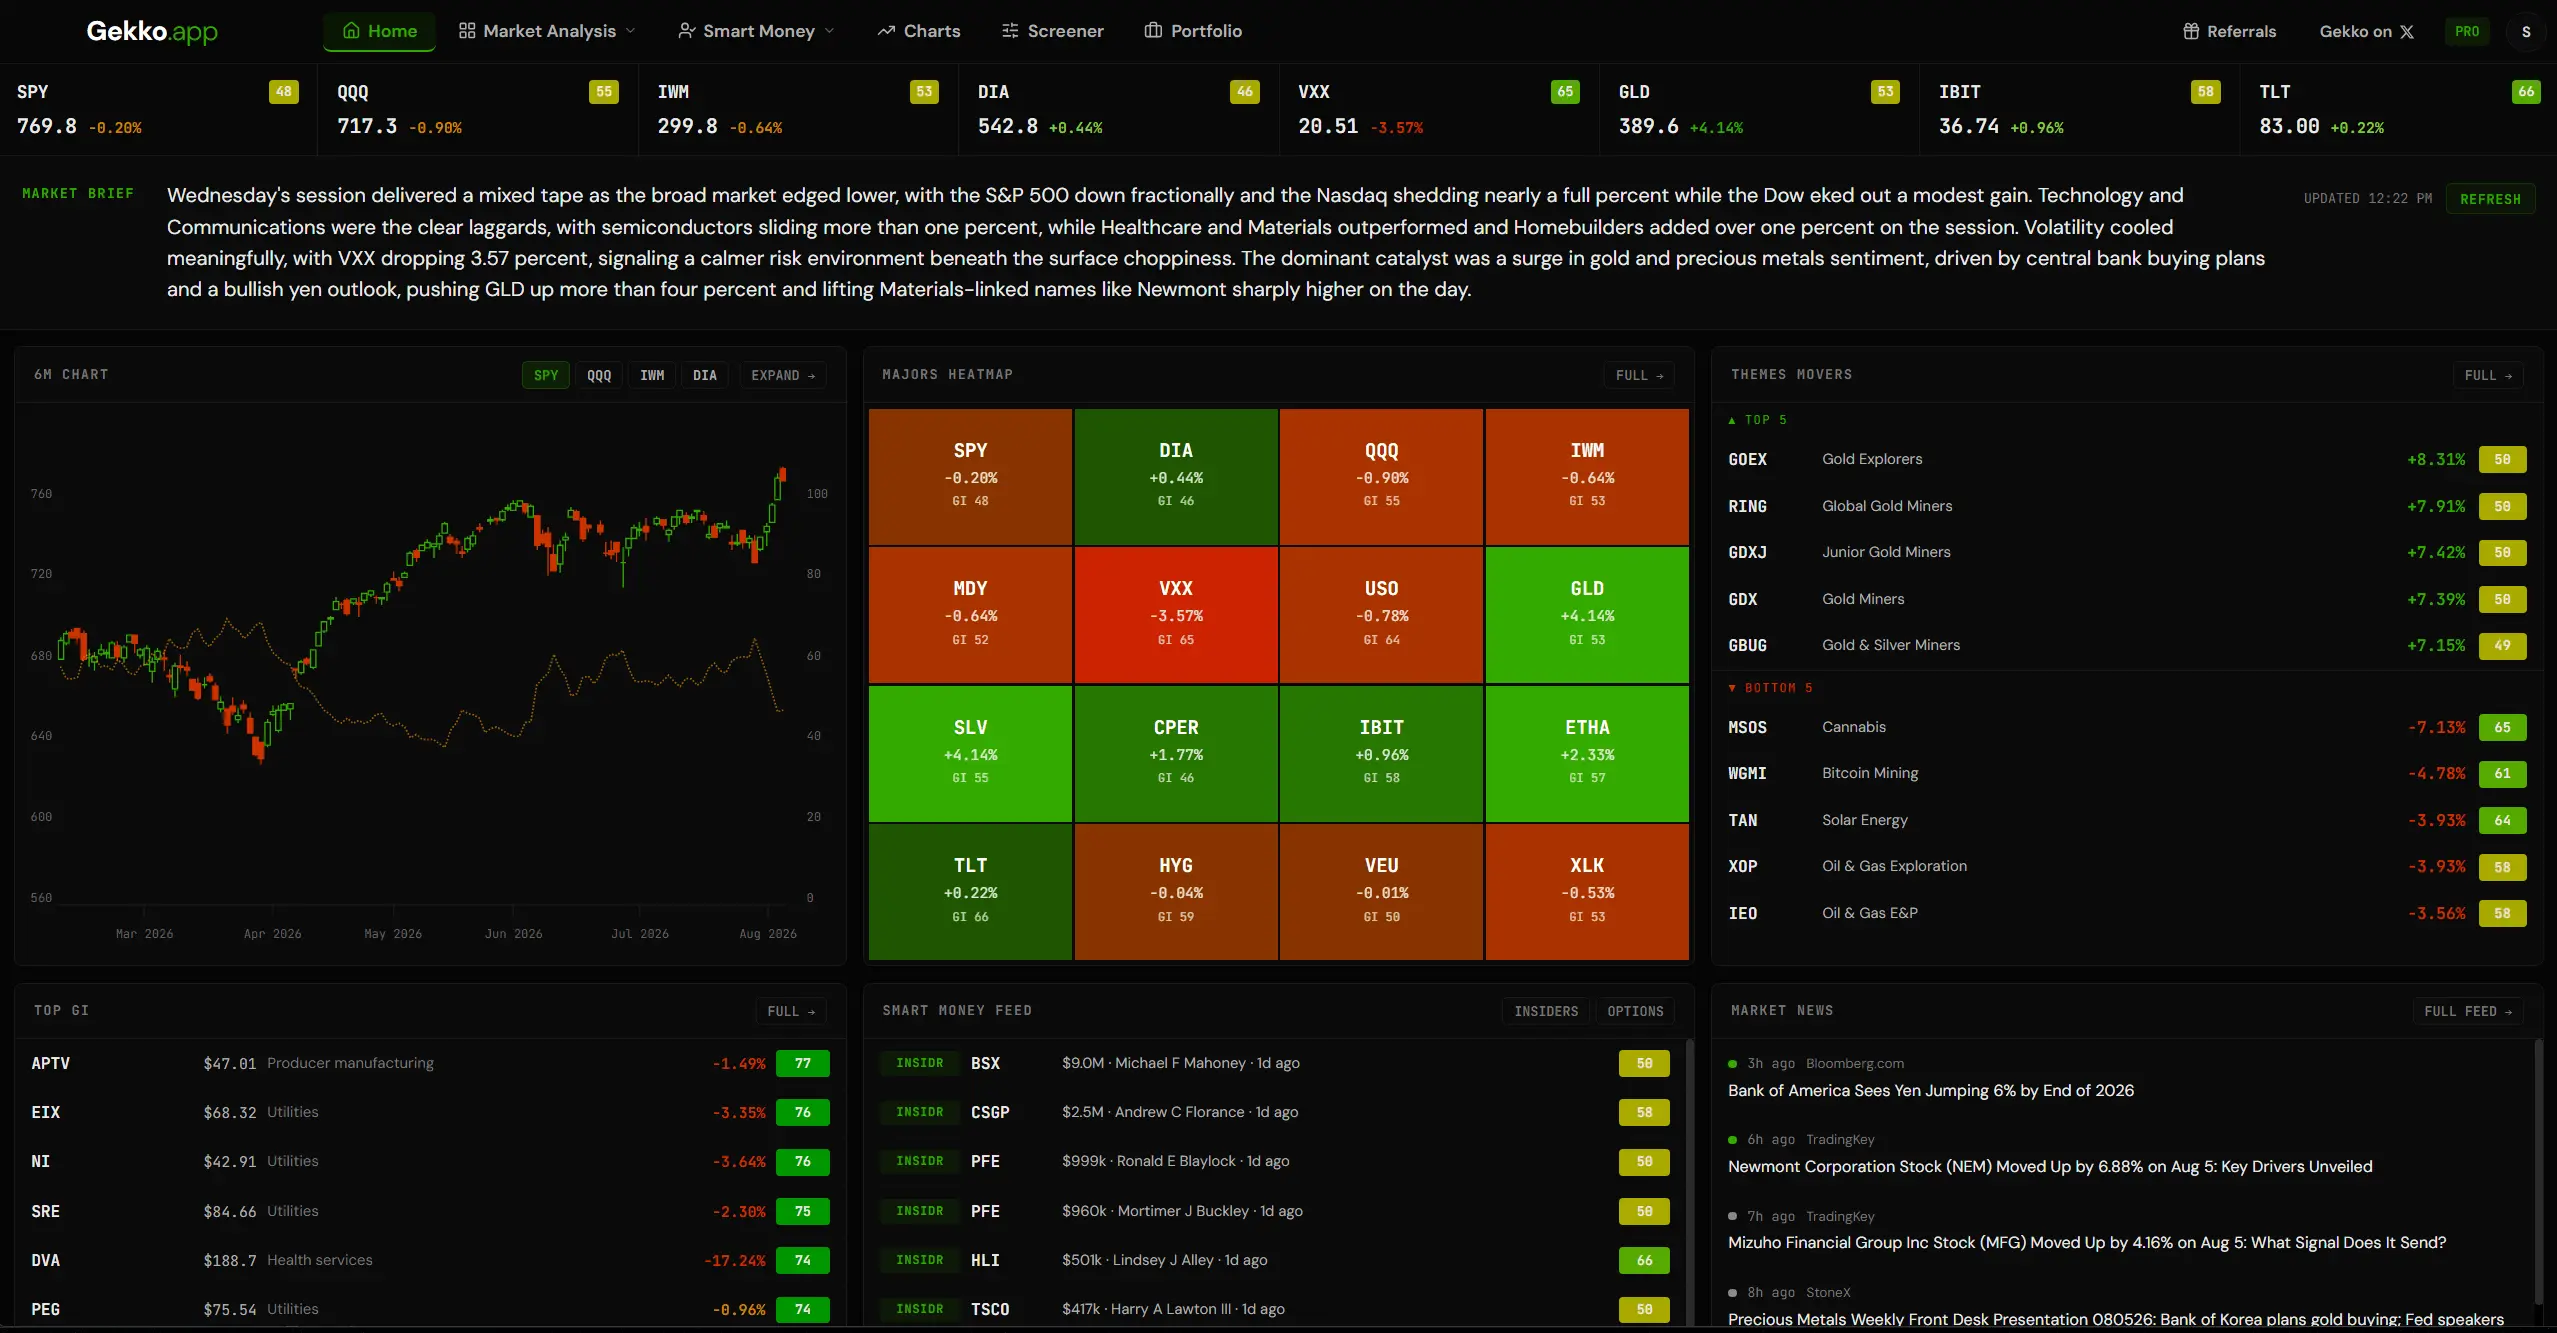
And the rest
Fundamentals, seasonality, heatmaps, rotation, breadth, the trade planner and backtester, portfolio, watchlists and more.
All features →New — exclusive to Gekko
Experience the power of TrendCandles™
Our new chart type colours every candle by the strength of the trend, so you can spot potential turning points and developing trends early.
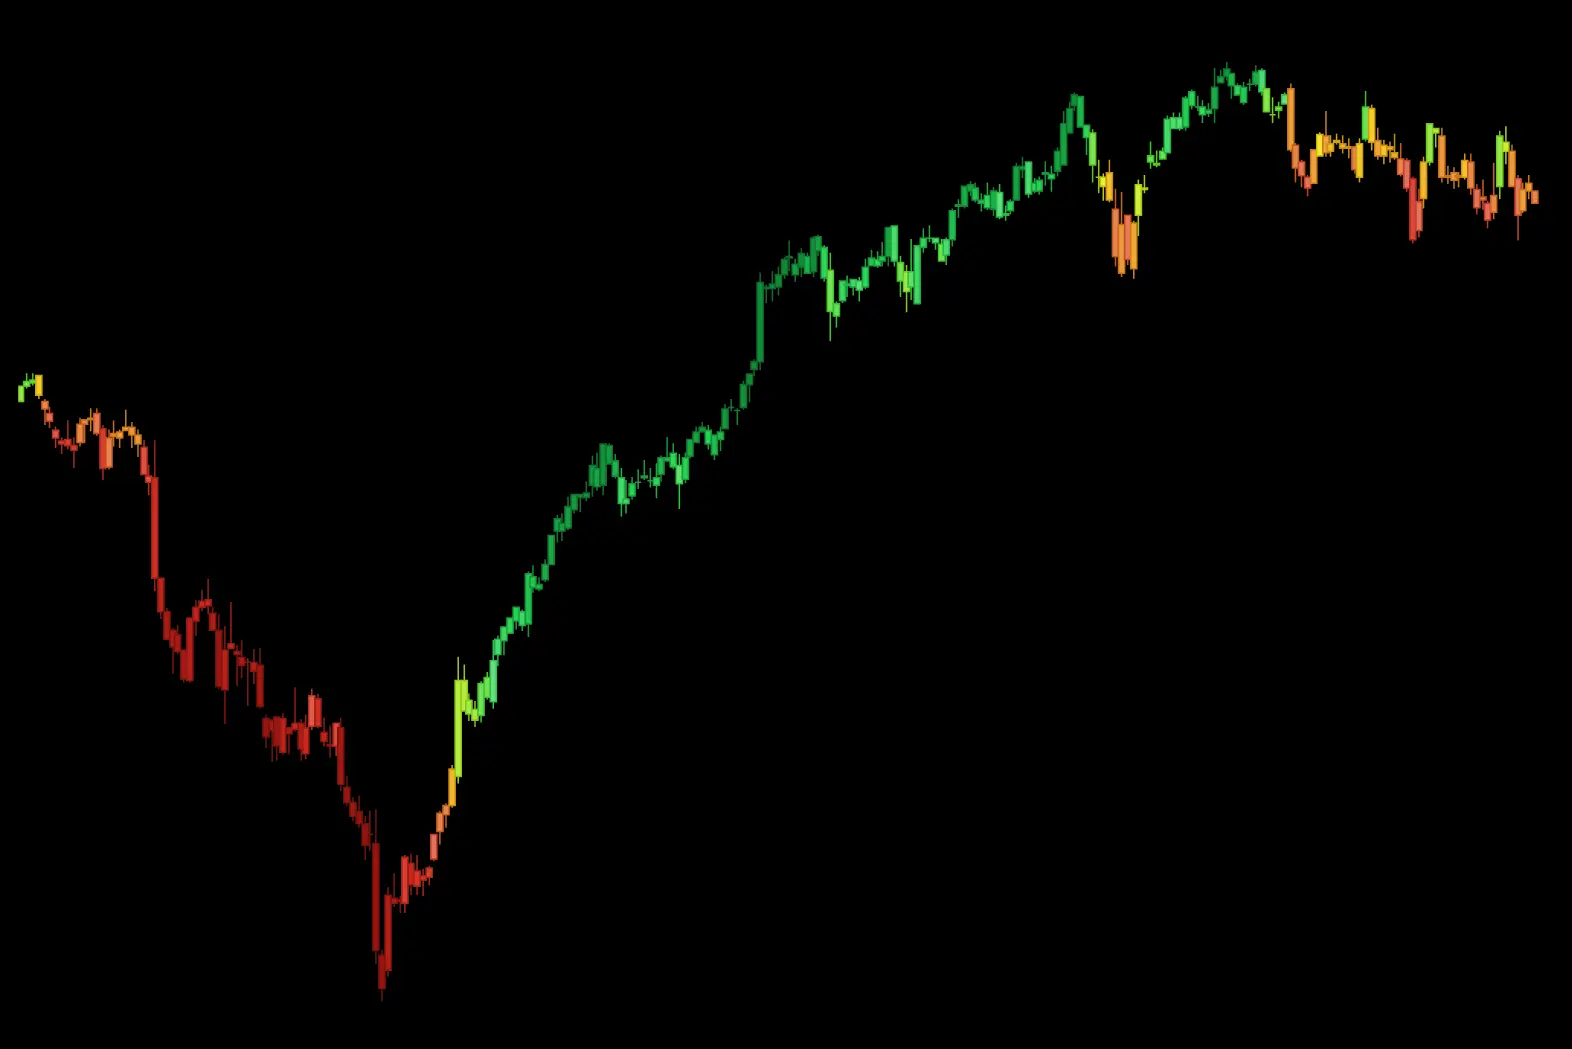
Deep green to deep red, with every shade between. The colour is the trend — read the whole chart in one pass.
The turn shows up before the breakout
Candles pale as a trend loses its grip and deepen as it takes hold, so a move that is quietly changing character looks different long before it clears an obvious level.
Works on every ticker, day one
No warm-up period, no minimum history and no dependency on any other signal. Every US stock and ETF we cover, on daily or weekly bars.
Proprietary to Gekko
Built in-house and available nowhere else. Sit it alongside the smart money markers and you get positioning and trend in a single view.
Swing trading software built by a trader who uses it every day
Gekko was built by Jared Mann, a trader with more than 20 years of experience in stocks and ETFs and a financial industry background. It is the tool he uses every day, shared with more than a thousand active traders around the world.
Jared was tired of using dozens of different tools to find the data behind a good trade, and so Gekko was born: the all in one smart money research platform. Read Jared's story →
Pricing
Start with 7 days free
No credit card, no plan to pick, nothing to cancel.
Sign up and use the entire platform free for seven days.
7 days free
Full access from the moment you sign up
- Every feature — no tiers, no add-ons
- 5,800+ US stocks and ETFs
- All 8 signal layers on every chart
- GekkoIndex™ and Fair Value scores
- Screener, portfolio and backtester
- Watchlists, charts and drawing tools
No credit card required. Nothing is charged during the trial.
Decide at the end of the week. If you want to carry on, it's $99 a month or $77 a month billed yearly — both plans include everything, and you can switch or cancel at any time. Compare the plans →
Questions, answered
Frequently asked questions
What exactly is Gekko?
Gekko is a research and analytics platform for US stocks and ETFs. It gathers the footprints that institutions, company insiders and politicians leave behind in public filings and market data, then plots them on charts and organises them into feeds, screens and scores. You get the proprietary GekkoIndex™, Gekko Fair Value, a screener, a backtester and a full market analysis toolkit across 5,800+ tickers, all in one dashboard.
Do I need a credit card for the trial?
No. Sign up with an email address and you have full access to every feature for 7 days. Nothing is charged, and there is nothing to cancel if you decide not to continue.
What makes it different from other tools?
Two things. First, the chart: insider buys, options flow, politician disclosures, buybacks, volume thrusts and reversals are all drawn on the price itself, dated to when each became public — most platforms leave that data sitting in separate tables. Second, the proprietary layers you cannot get elsewhere: the GekkoIndex™ score and Gekko Fair Value, both calculated in-house and shown on every ticker. It is built by a long-time active trader with a financial industry background, not a data vendor.
Start seeing the footprints
The largest investors in the market leave a trail in public filings and market data. Gekko collects that trail, dates it, and puts it on the chart in front of you. Take a week and see what your own watchlist looks like with it turned on.
Join — other traders using Gekko
Start Your FREE 7 Day Trial → Every feature unlocked. No credit card required.