The GekkoIndex™ — One score for the smart money picture on any stock
A proprietary 0 to 100 reading, on every stock and ETF Gekko covers, that estimates how much institutional buying or selling is behind recent trading. Sort the market by it, plot it over price, alert on it, and check what followed past readings.
Every feature unlocked. No credit card required.
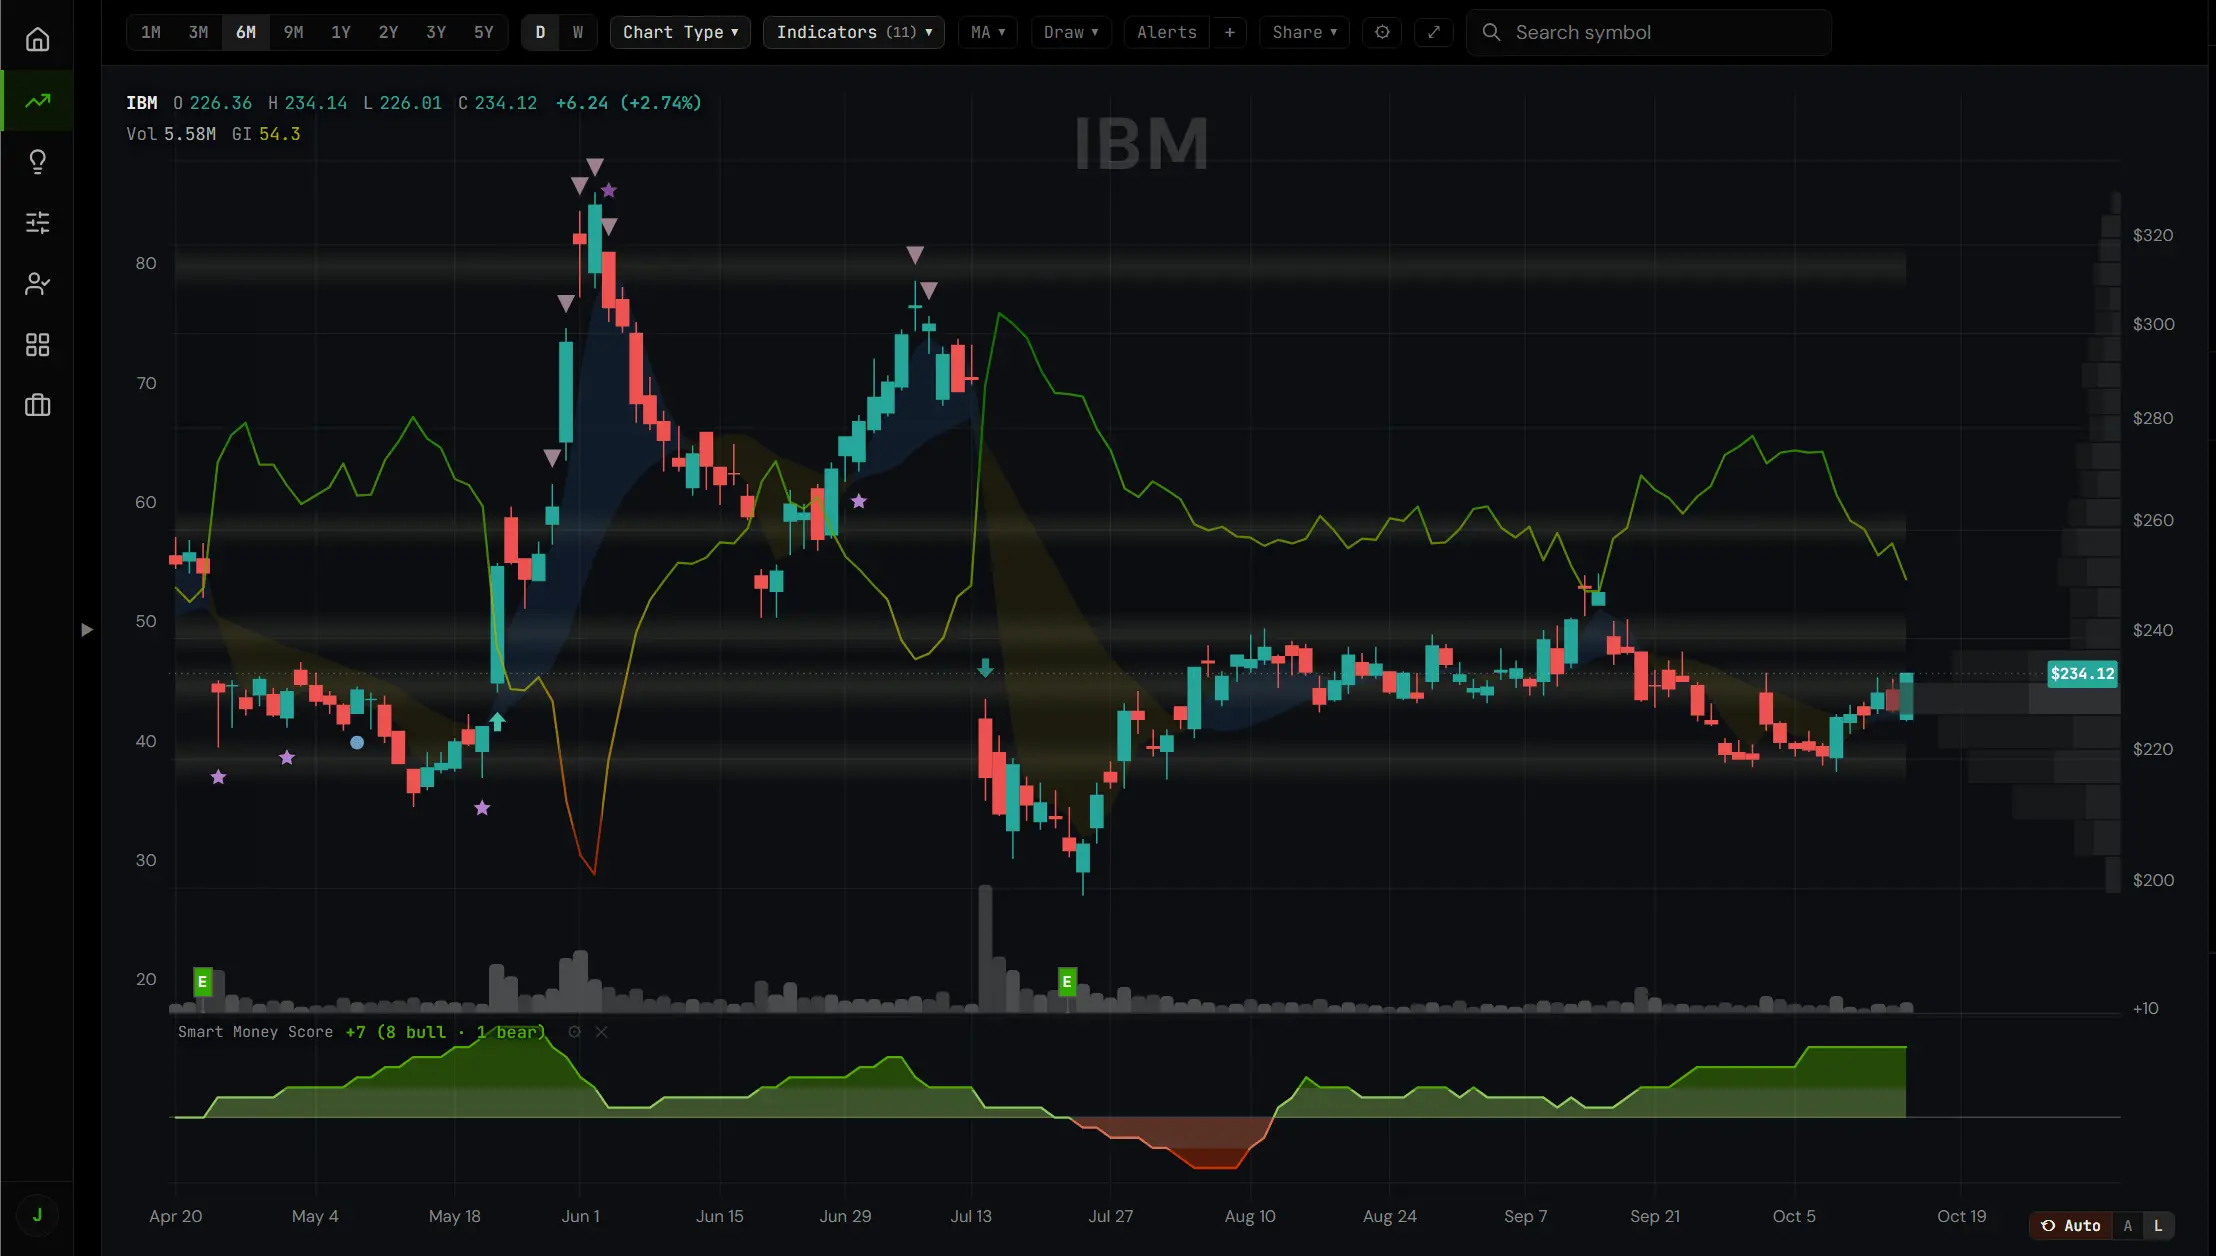
The GekkoIndex drawn over price and coloured by zone — green in the buying end, red in the selling end — with the Smart Money Score pane underneath.
High is the buying end
The GekkoIndex runs the opposite way to the oscillators you may have used elsewhere. A high reading means institutions appear to be accumulating the stock while it is oversold — the end where opportunity tends to sit. A low reading means distribution: smart money appears to be exiting while the stock is overbought.
- Buying (70+) and Accumulation (60–70) — heavy to building institutional interest
- Neutral (45–60) — no clear directional signal
- Distribution (33–45) and Selling (under 33) — institutions offloading to exiting
- The colour on any GI number, anywhere in Gekko, tells you the zone at a glance
The zones are the public face of the index. How the score itself is built is Gekko's own and is not published — what is public is what it measures, the five zones, and the record of what followed each reading.
What followed past readings
Beside every chart, the gauge shows the current reading and zone, and the table below it shows the average share-price change that followed each daily reading in each zone — on that stock — over five horizons, from the next fifty trading days out to the next five hundred.
These are averages of what happened, not forecasts, and they are shown only once they rest on enough readings. They are there so you can see what the signal has actually been worth on a specific name instead of taking it on faith — and so the Trade Planner can backtest a plan against the stock's own history from the zone it is in now.

Everywhere in the platform
One number, read through the same lens on every page — so any list of stocks can be sorted, filtered and alerted by it.
Three ways on the chart
As zone signals — a marker on the bar a stock enters a zone, with a filter for which zones — as an overlay line coloured by zone over the price, or in its own lower pane. The Smart Money Score sits beside it, netting every bullish marker against every bearish one.
In every list
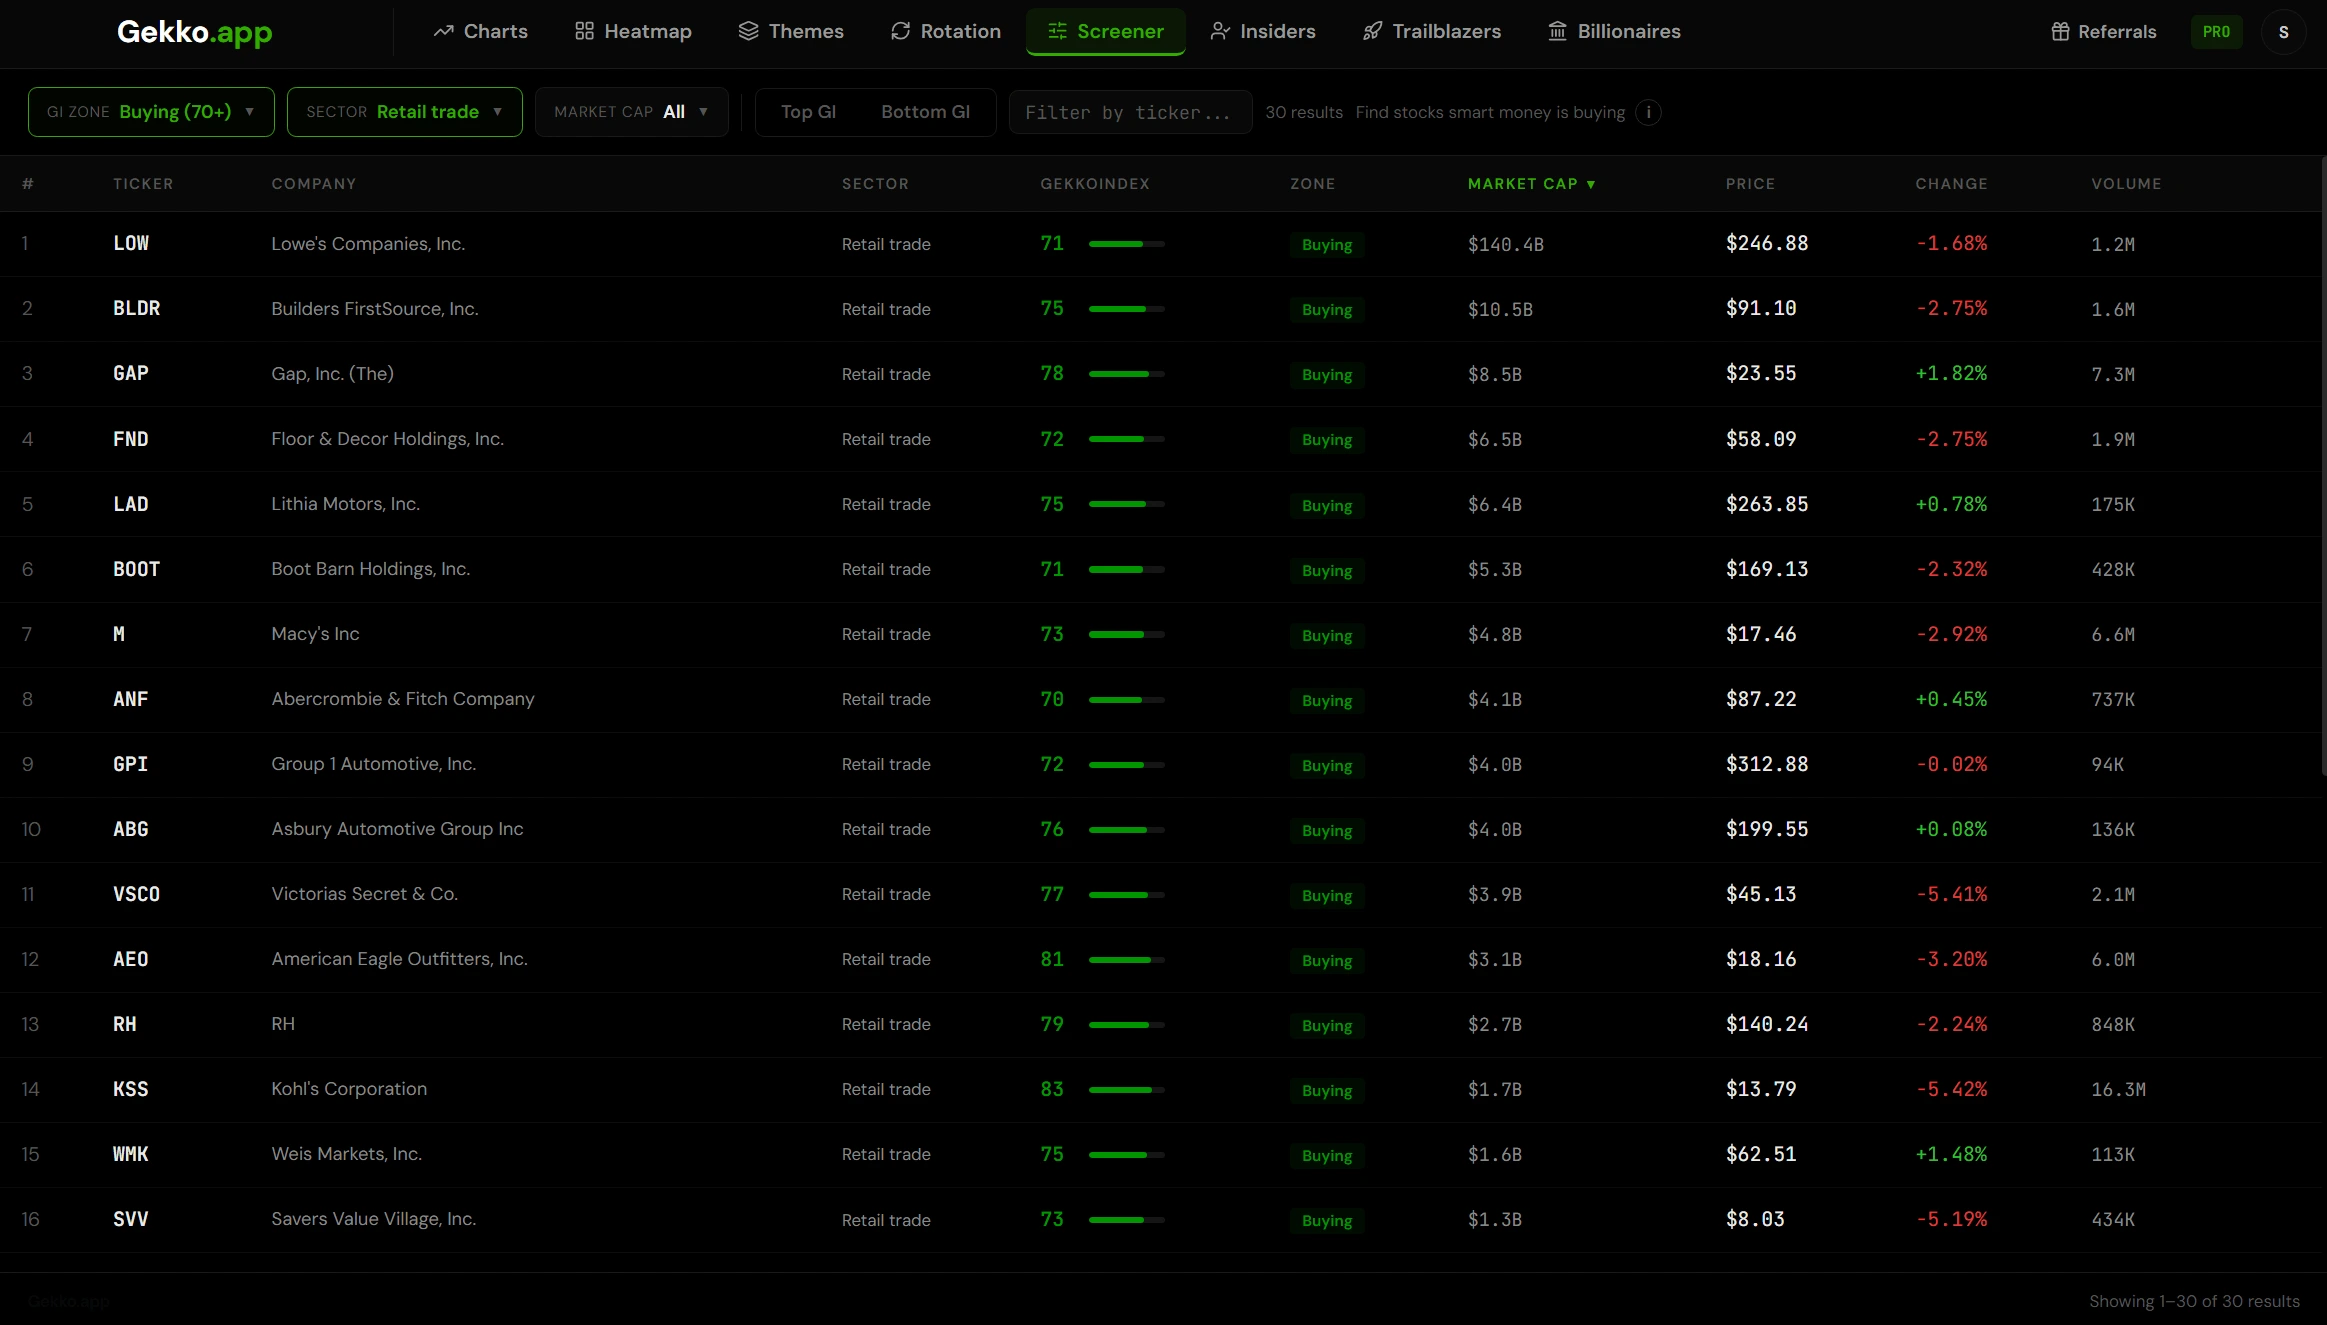
The GI column is on the screener, every watchlist, the insider, options, analyst and politician feeds, the portfolio and the earnings calendar. The screener ranks all 5,800 names by it and filters by zone; the GI Buy Zone and GI Sell Zone watchlists update themselves through the day, by market cap.
Driving alerts and ideas
Set an alert when a stock enters a zone or crosses a reading you choose, in the app or by email. The heatmaps colour by it, and the AI trade ideas read it as one of the signals an idea has to carry before it reaches the board.
Inside Gekko
- The gauge and zone table beside every chart, and the GekkoIndex as signals, an overlay or its own pane
- The screener ranks all 5,800 names by GekkoIndex and filters by zone, sector, industry and market cap
- Eight GI Buy Zone and GI Sell Zone watchlists, by market cap, refreshed through the day
- Heatmaps coloured by GekkoIndex across the S&P 500, the majors, your lists and every theme
- Alerts when a stock enters a zone or crosses a reading you choose
- The GekkoIndex™ whitepaper for the long form
On the free stock pages, too
Every stock page shows the current GekkoIndex reading, its zone, the change over the last five sessions and the stock's own zone track record, with a comparison against the whole universe. The methodology page explains what the zones mean. The daily history, the chart overlay, the alerts and the screener are inside Gekko.
Questions about the GekkoIndex™
Is a high GekkoIndex good or bad?
High is the buying end. A high reading means the stock looks oversold and institutions appear to be accumulating it; a low reading means it looks overbought and they appear to be distributing. It runs the opposite way to most oscillators, which is the single most misread thing in the product — so it is worth saying plainly.
How often does the GekkoIndex update?
Every fifteen minutes through the US session for roughly 5,800 liquid US stocks and ETFs, with a final reading after the close.
Is a Buying-zone reading a buy signal?
No. It describes the data — an estimate that institutional buying has been heavy recently — and the zone track record shows what followed past readings on that stock. Gekko does not make buy or sell recommendations.
How is the score calculated?
The inputs, weightings and thresholds are Gekko's own and are not published. What is public is what the score measures — where price sits against its own recent behaviour, whether volume is unusual, and what short sellers are doing — the five zones, and the record of what followed each reading.
See it on your own watchlist
Every feature, free for seven days — nothing to enter, nothing to cancel.
Start Your FREE 7 Day Trial → Every feature unlocked. No credit card required.