GEX levels and dark pool flow, on the stock chart — not in another tab
The Call Wall, the Put Wall and the Gamma Flip, drawn on the price from the full options chain for around 2,000 US stocks and ETFs. Underneath, a Dark Pool Index that shows what off-exchange volume is doing against the stock's own normal. Two things traders used to buy separately, beside the insider buys and the GekkoIndex.
Every feature unlocked. No credit card required.
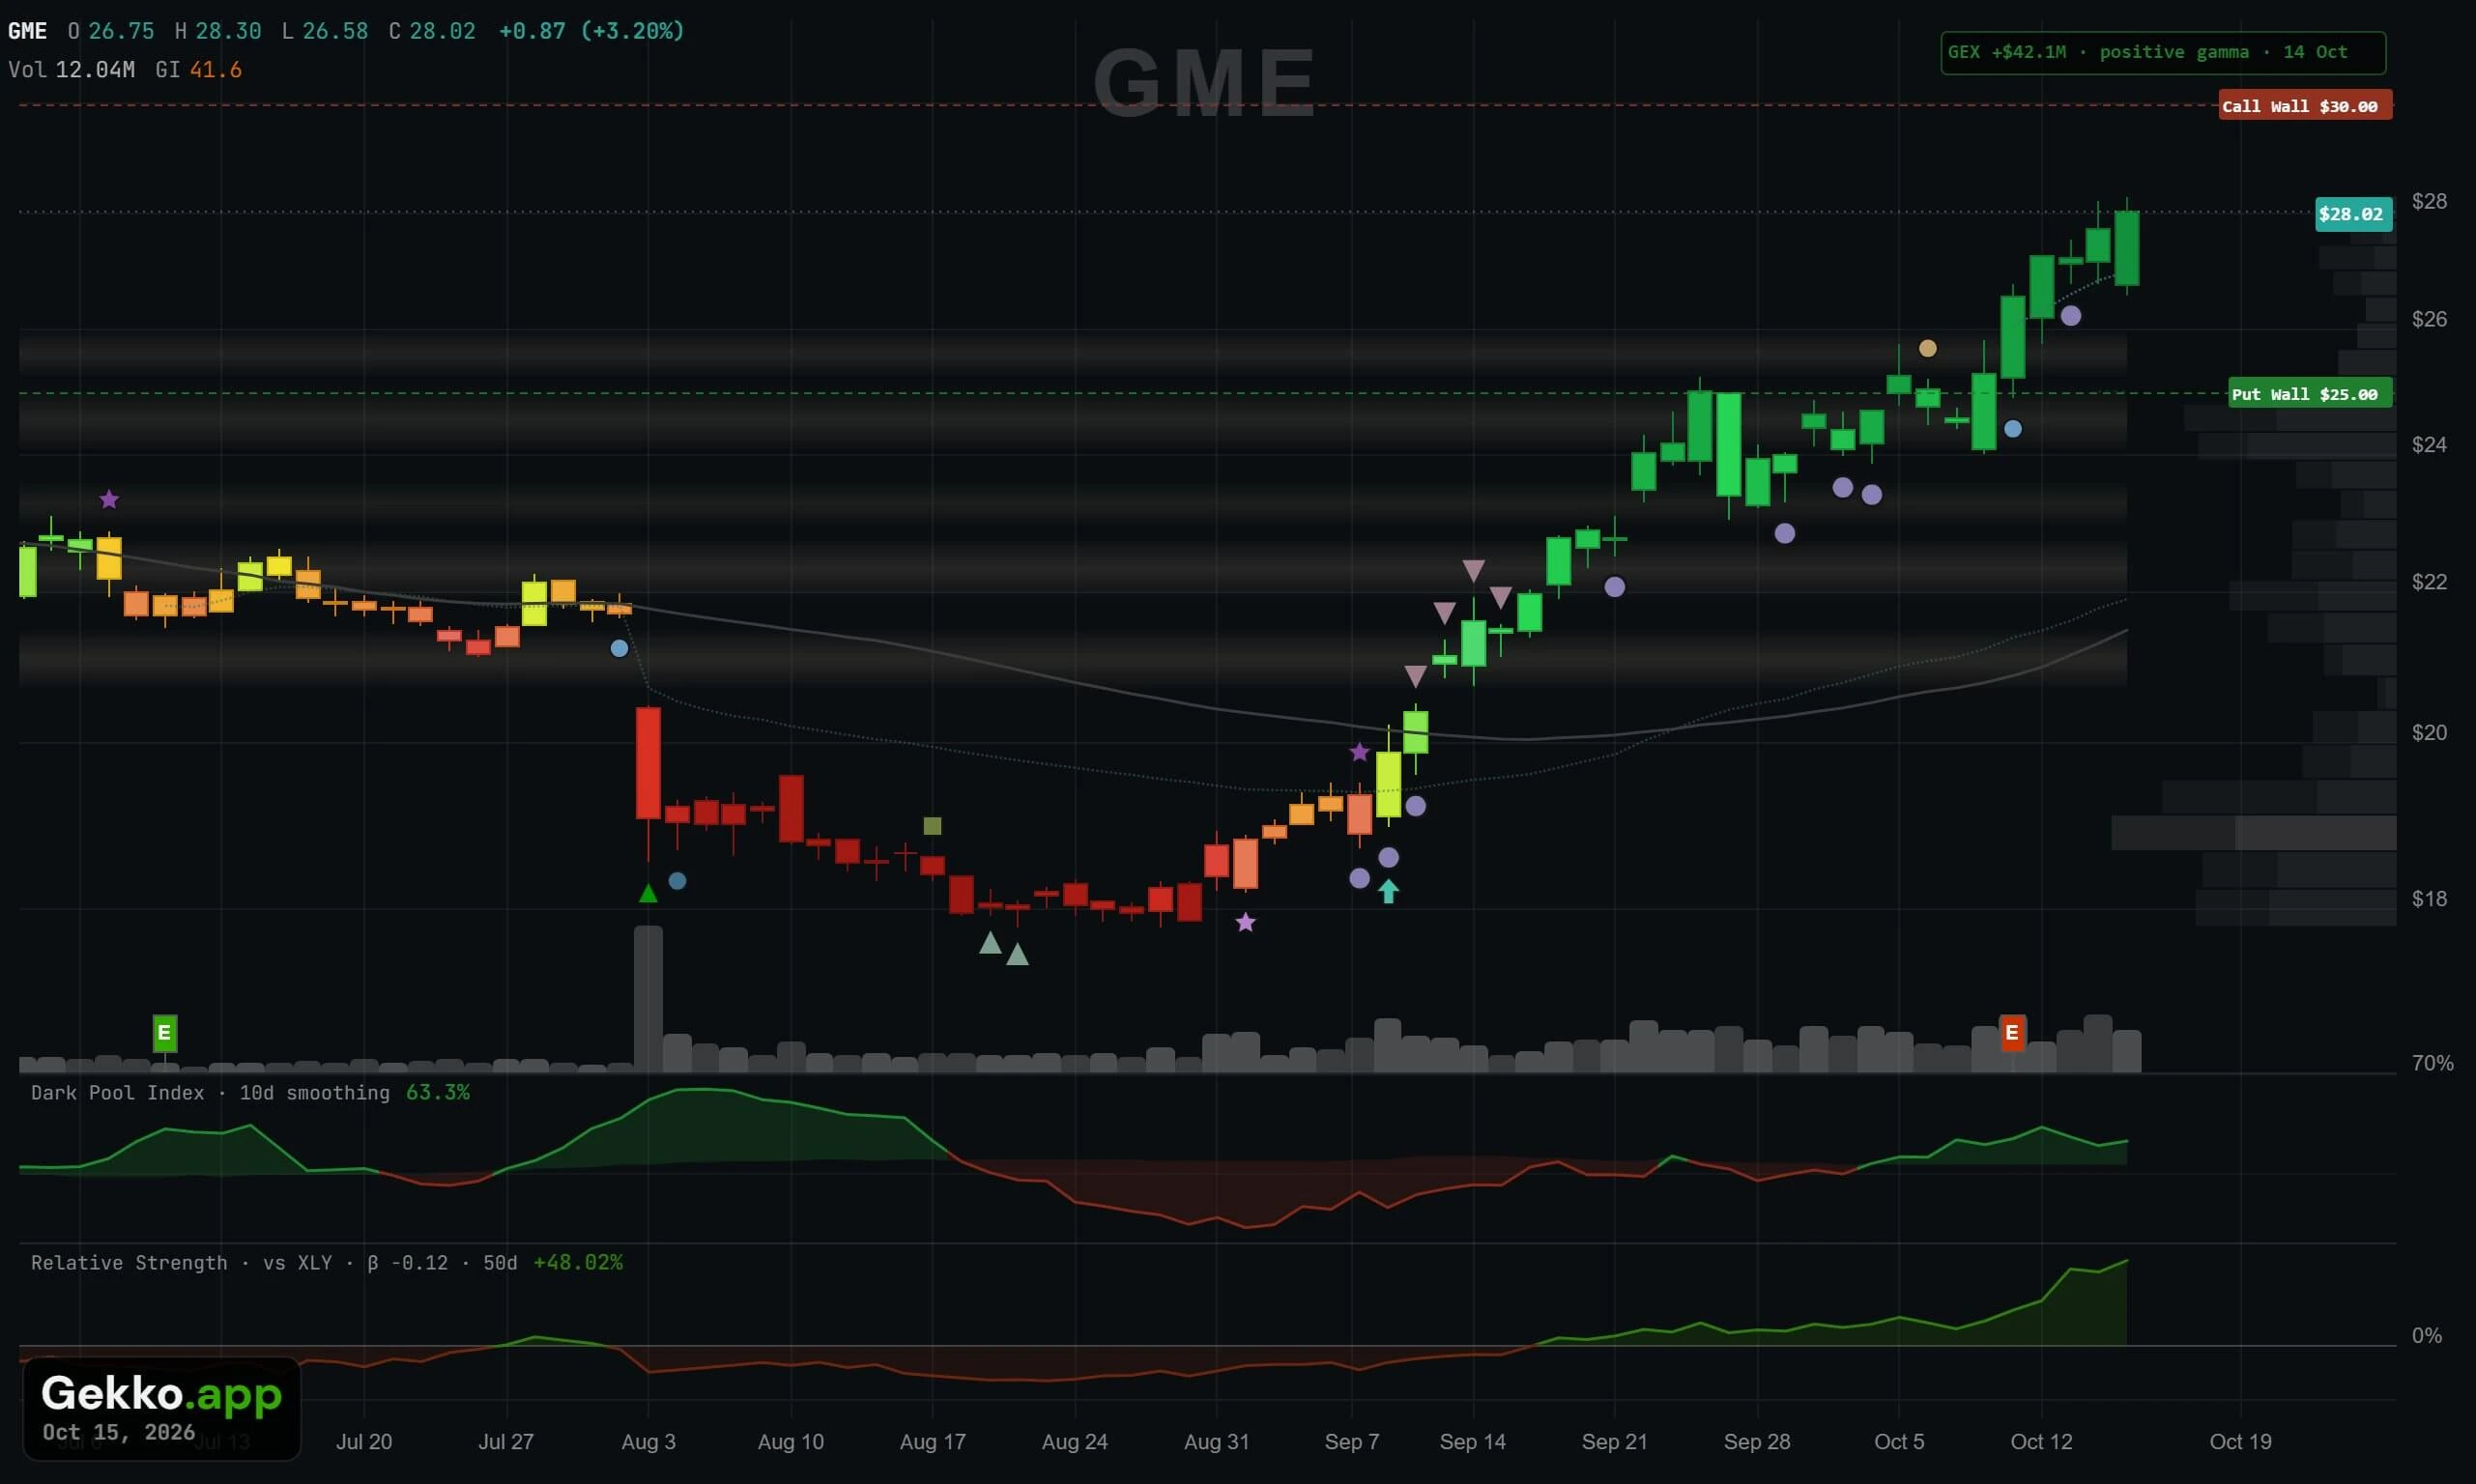
GME: the Put Wall at $25 held as support, the Call Wall sits at $30 overhead, and the Dark Pool Index turned green before the run.
Three levels that tell you where dealers are hedging
Market makers who sell options have to hedge them, and that hedging buys and sells stock in predictable places. GEX Levels finds those places in the open interest and draws them as dashed lines with a tag on the right edge — the same way the last price is tagged — so they read like any other level on your chart.
Where rallies stall
The strike above price carrying the heaviest call positioning. As price approaches it, dealers hedging those calls tend to sell into strength, so it often acts as a lid — and as a sensible target for a swing that is already underway.
Where sell-offs find a floor
The mirror below price: the strike with the heaviest put positioning. Hedging flows tend to buy into weakness as price falls towards it, which is why it so often marks support — and the level traders watch for a swing entry.
Where the regime changes
The price at which dealers' net gamma crosses zero. Above it, their hedging dampens moves and dips tend to get bought. Below it, hedging amplifies moves and they run further than they should. The readout in the chart's corner tells you which side a stock is on today.
Positive gamma, negative gamma
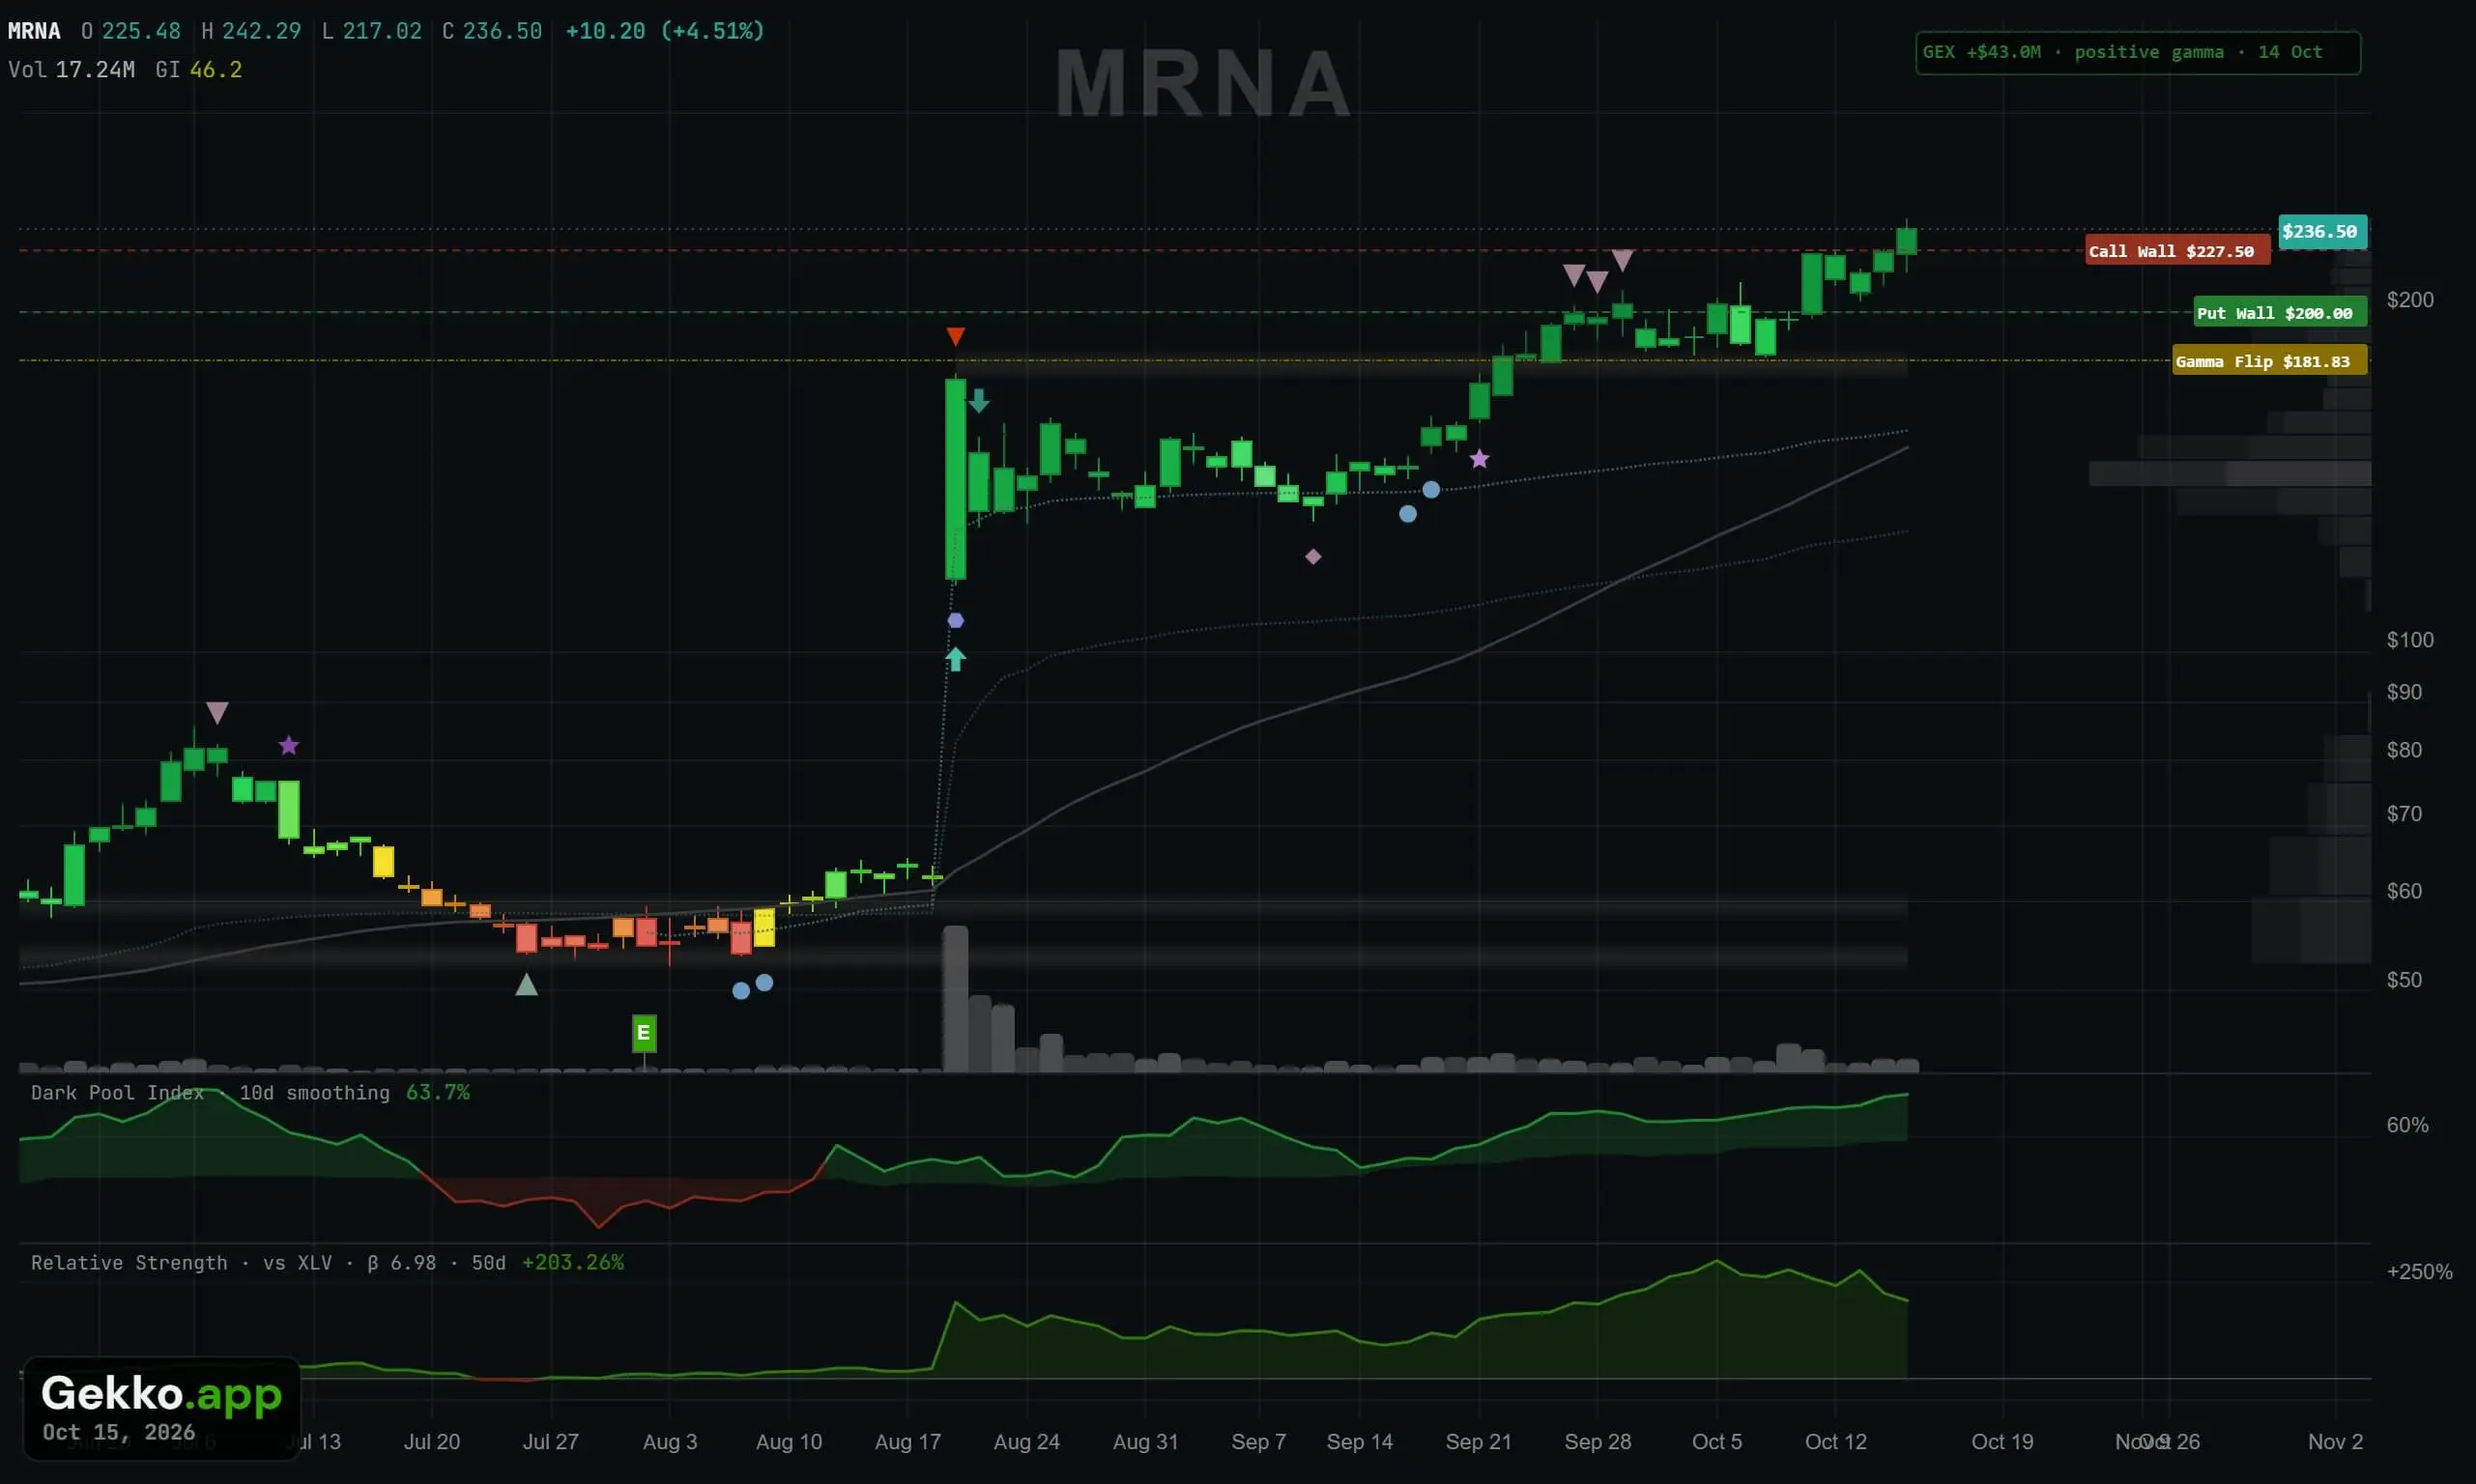
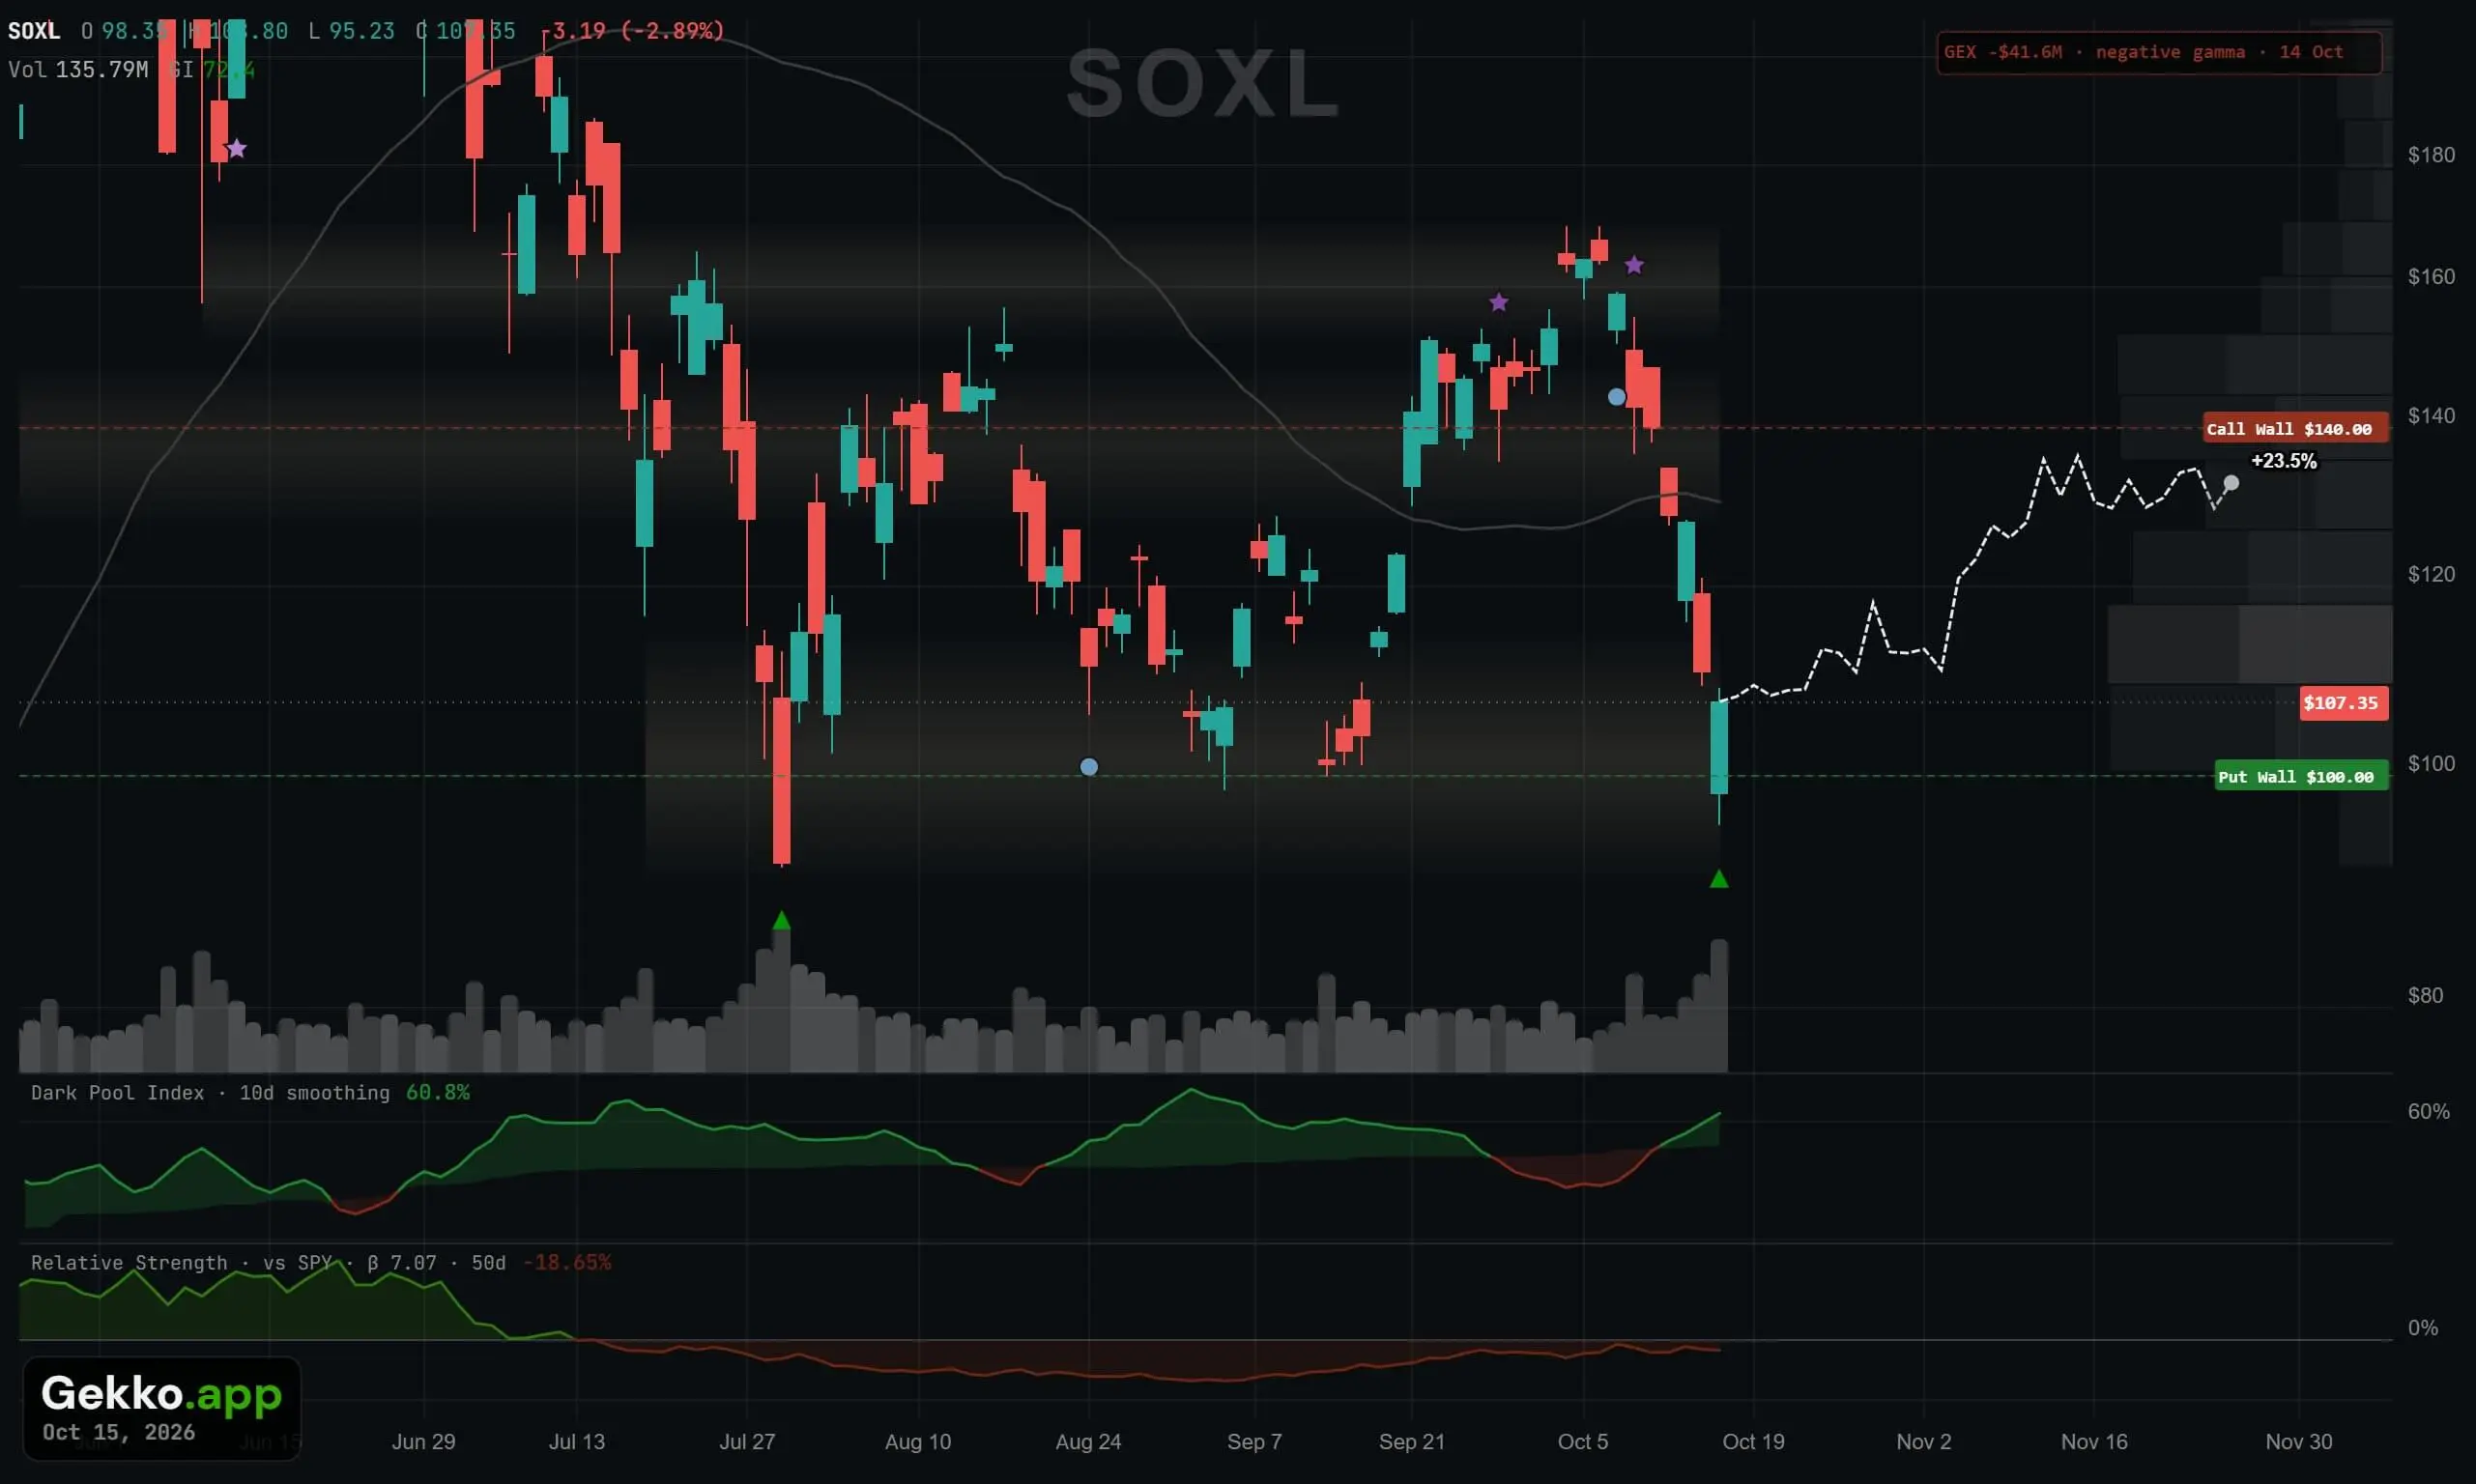
The readout at the top-right of the chart — net gamma exposure, the regime and the date of the chain it came from — is the first thing to look at. The two charts below show why.
Also on the chart
Max pain
The strike where the most option value would expire worthless at the nearest expiry — the level price has a habit of drifting towards into an expiry — switchable on as its own line beside the three walls.
The strike profile
Call exposure drawn against the price axis and put exposure beside it, one bar per strike, the wall strikes brighter — so you can see how lopsided the positioning is, not just where the two biggest strikes sit.
Wall history
Where the Call Wall and Put Wall sat on each past day, as faint stepped lines — so a wall that has been migrating upwards for two weeks reads differently from one that just appeared.
What off-exchange volume is doing under the price
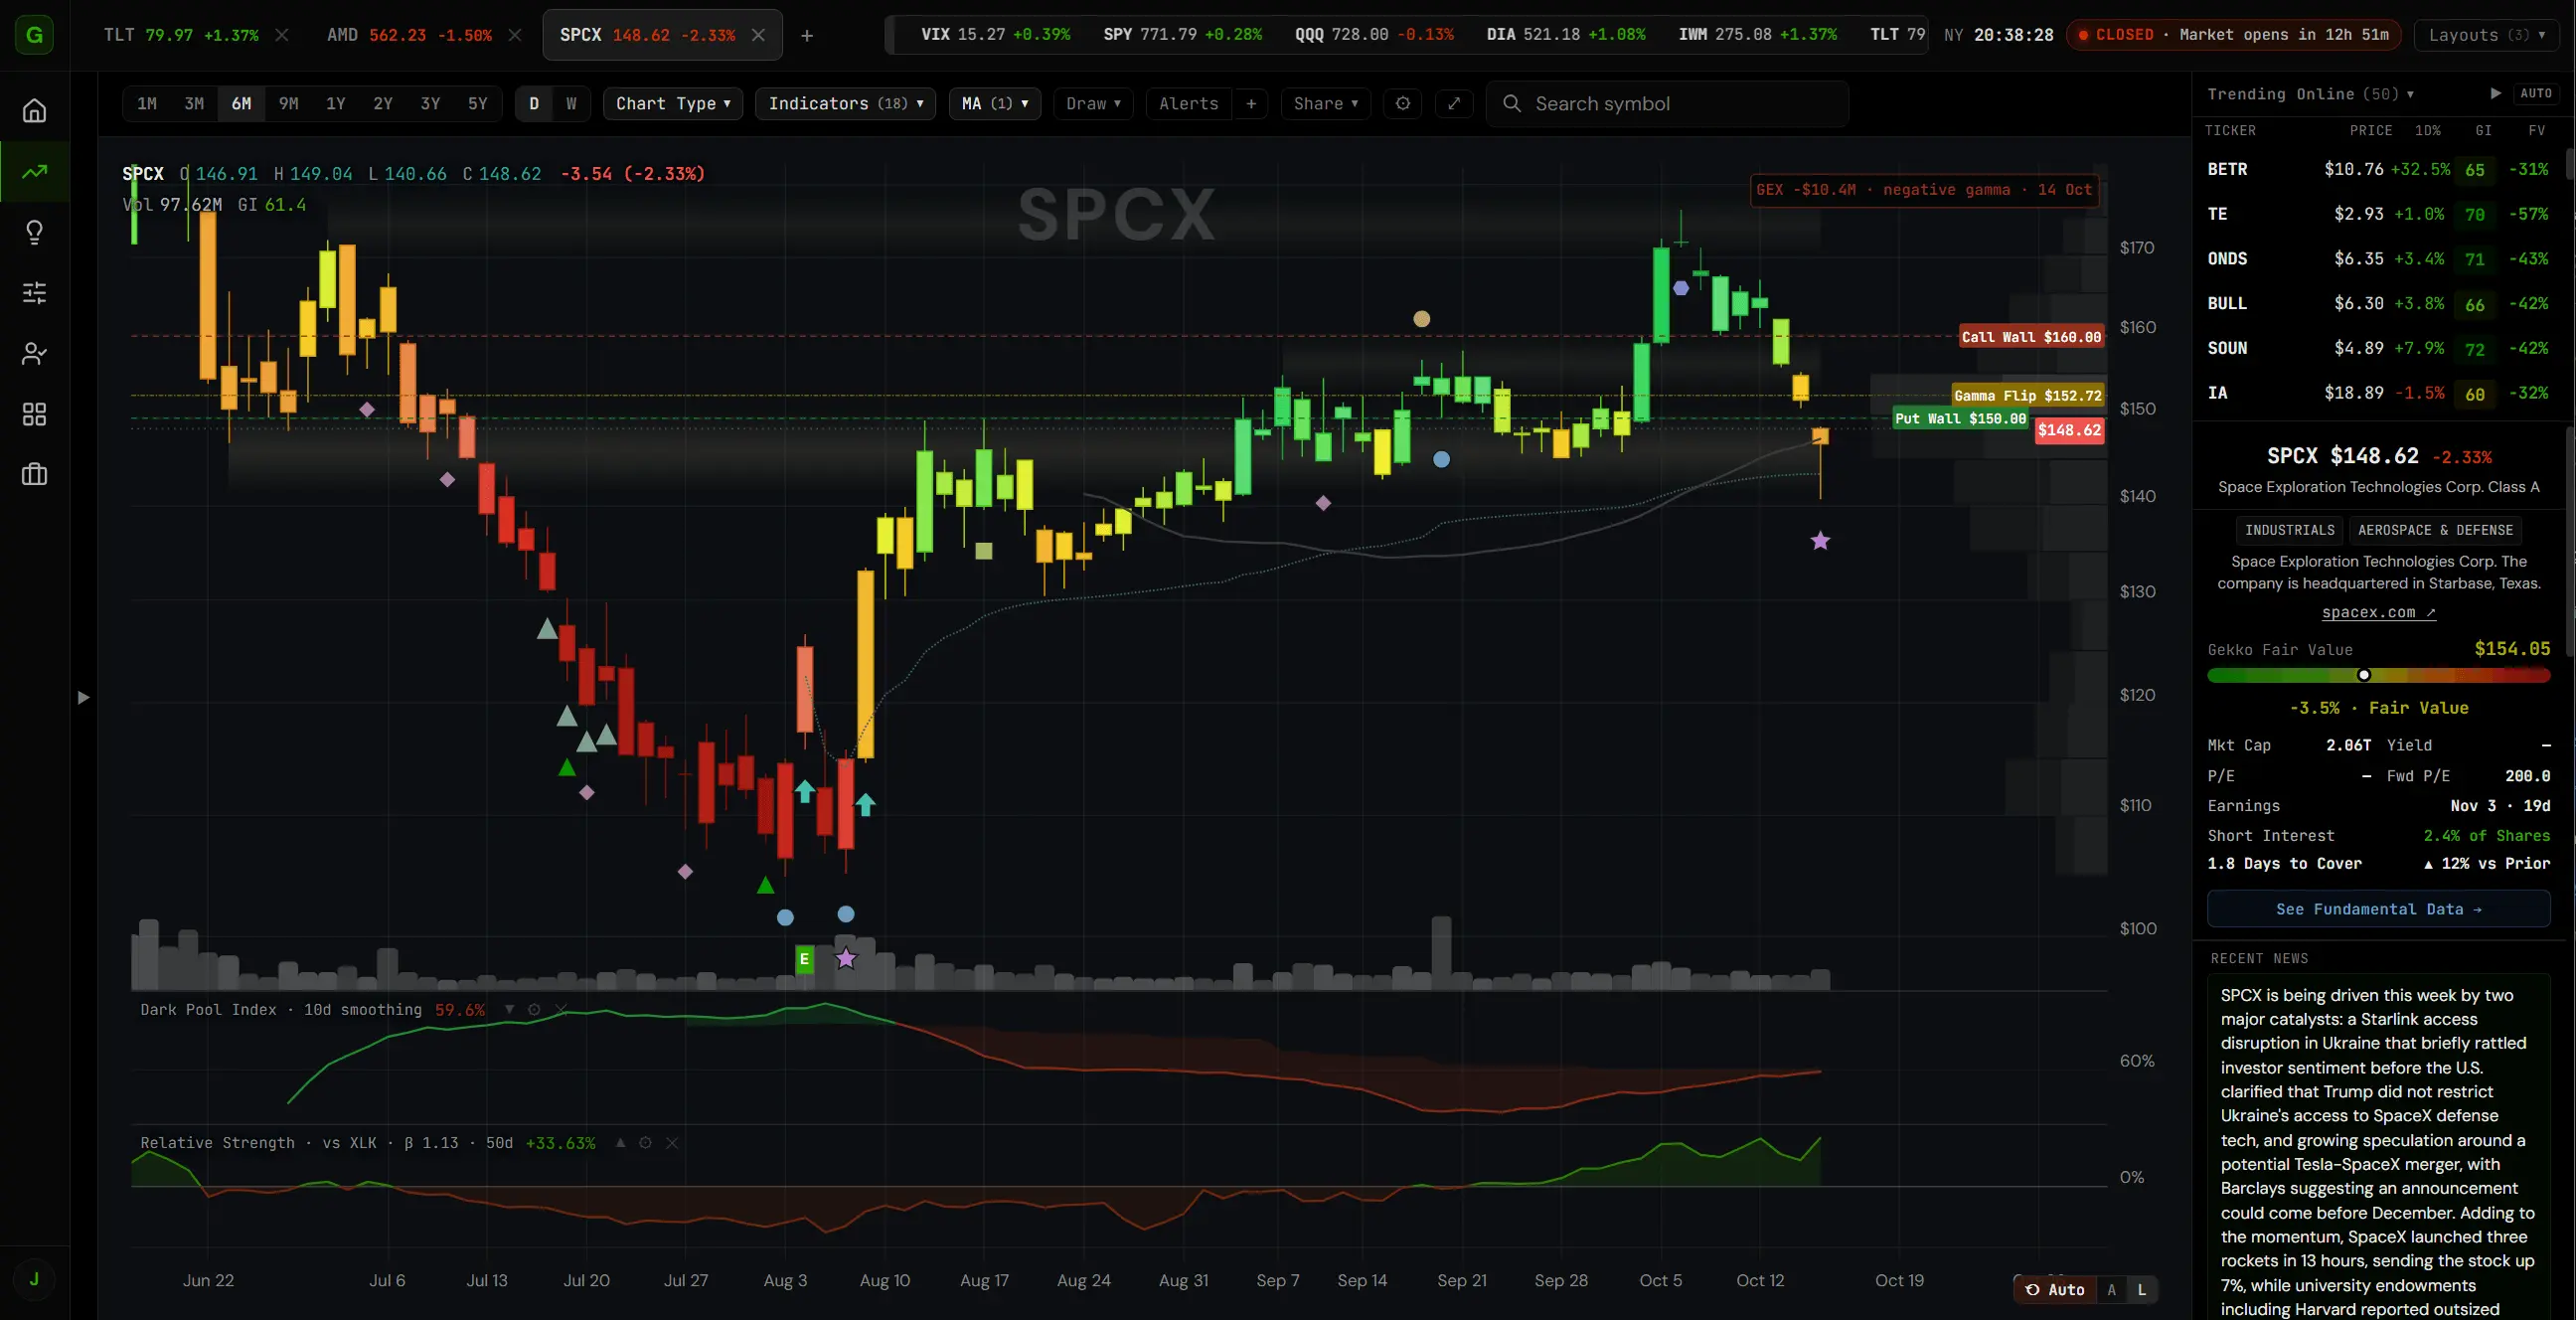
A large share of US stock volume trades off-exchange, in dark pools, and FINRA publishes how much of it was sold short every day. The Dark Pool Index puts that ratio in its own pane under the chart, smoothed over twenty bars by default, and — the part that matters — measures it against the stock's own normal range rather than a fixed line.
- Green above the stock's rolling median, red below it, with the usual range shaded in grey
- A sustained rise above the stock's normal is often read as off-exchange buying pressure; a fall below it as selling
- Daily and weekly bars, the raw daily ratio as a faint line behind the smoothed one, smoothing and colours to your taste
- A per-stock reading, not a market-wide index — so it says something about this name
How subscribers use it
Gekko does not make recommendations. This is the workflow the levels were built for.
Read the regime first
Positive gamma: expect moves to be dampened and the walls to hold. Negative gamma: expect moves to run, and treat the Put Wall as the first place a sell-off might stop rather than a guarantee.
Plan around the walls
The Put Wall is where many traders look for a swing entry and the Call Wall for a target. Plot the trade on the chart, let the Trade Planner backtest it, and set alerts on both levels in one click.
Confirm with the footprints
A Put Wall is more interesting when an insider bought near it, the Dark Pool Index is above its normal and the GekkoIndex is in the buying end. The point of having everything on one chart is that the confluence is visible.
Open any optionable ticker with GEX Levels and the Dark Pool Index switched on.Included in every plan and the trial — no add-on, no extra data subscription.
Start Free Trial →Questions about GEX Levels and the Dark Pool Index
What is GEX, or gamma exposure?
Gamma exposure is an estimate of how much stock options dealers have to buy or sell to stay hedged as the price moves, worked out from the open interest at every strike. Where that exposure is concentrated, hedging flows cluster — and those are the levels Gekko draws: the Call Wall, the Put Wall and the Gamma Flip. Net gamma across all strikes gives the regime, positive or negative.
How often are the levels updated? Are they real-time?
They are recalculated from the full options chain after every US close and dated to the chain they came from, which is shown in the readout. Gamma levels are a positioning picture and move with open interest, not tick by tick, so a nightly refresh is how most dedicated gamma services work too.
Which stocks have GEX Levels?
Around 2,000 of the most liquid optionable US stocks and ETFs — the same universe as Gekko's unusual options activity feed. A ticker outside it shows "no options data" on the indicator row rather than an empty line.
Is the Dark Pool Index the same as DIX?
It is built from the same FINRA off-exchange short-volume data, but it is a per-stock reading drawn against that stock's own normal range, not a single market-wide index. Gekko shows it for every stock and ETF with the data, as a chart pane, beside the GEX levels and the smart money markers.
Does this cost extra?
No. GEX Levels and the Dark Pool Index are part of the indicator library in every plan and in the free trial, like everything else in Gekko. There are no tiers and no data add-ons.
See the walls on your own watchlist
Every feature, free for seven days — nothing to enter, nothing to cancel.
Start Your FREE 7 Day Trial → Every feature unlocked. No credit card required.