Everything inside Gekko: every smart money signal, one stock analysis tool
The chart signals, the scores, the trackers, the screener and the tools that act on them — each with its own page below. Every one of them is included in the free trial and in both plans.
Smart money charts: every signal on one stock chart
Everywhere else you hunt through separate tables for insider filings, options activity and congressional disclosures, then try to remember where the price was at the time. Gekko draws them straight onto your chart, on the day each one became public.
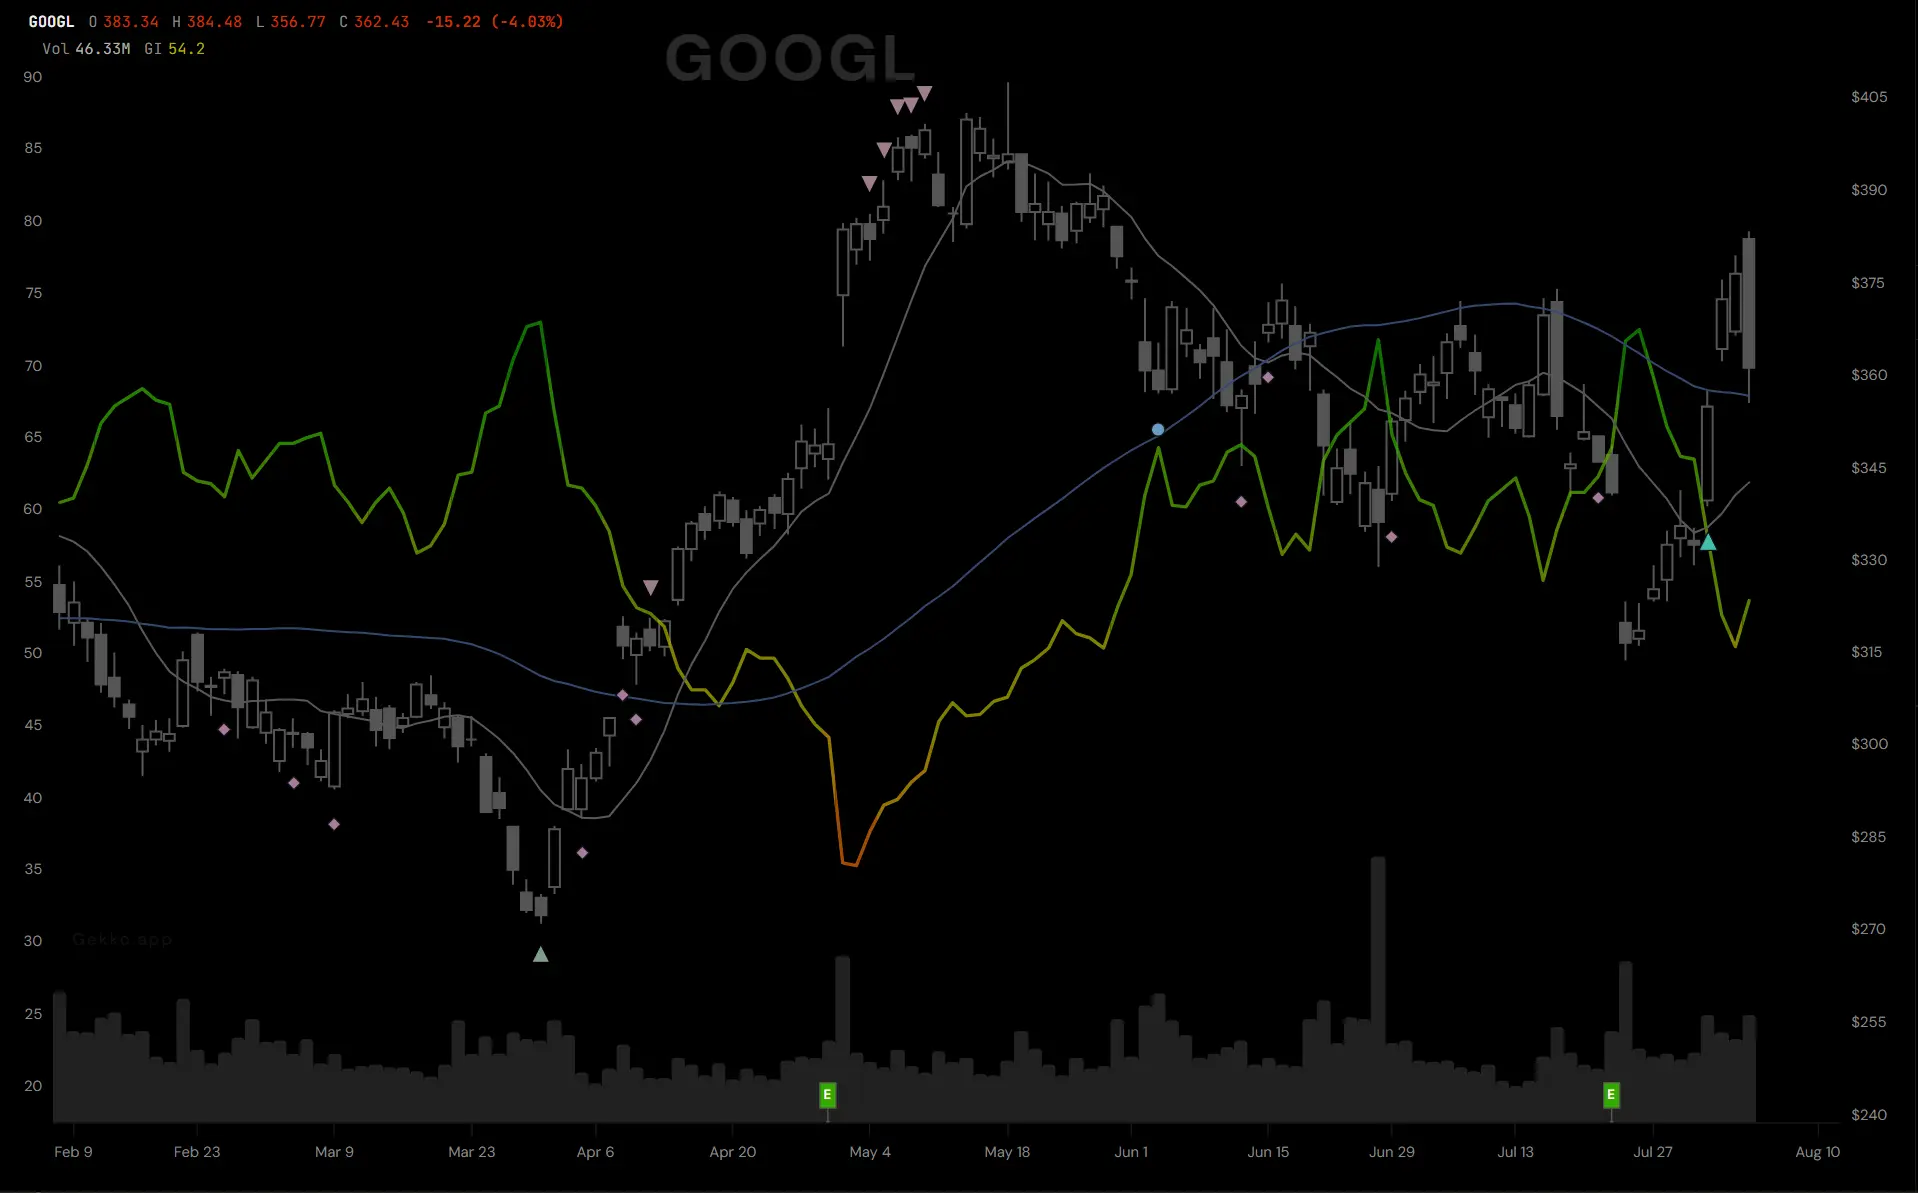
Every marker is clickable. Hover one to see who bought, how much, and on what date.
Insider buys
A CEO, CFO or 10% owner buying their own company's stock with their own money — the one trade nobody makes by accident.
Options flow
Unusually large call and put positions, measured against the size of the company rather than a flat dollar figure — so mid-caps show up, not just the mega-caps.
Hedge funds
What Buffett, Ackman, Coleman and ninety more did with the stock last quarter, from their 13F filings — one marker per quarter showing whether more of them were buying or selling, with the names on hover.
Politician trades
Congressional and Senate disclosures, plotted on the day they became public — not the trade date, which can be up to 45 days earlier.
Buybacks
The company itself announcing it is buying back its own shares, pulled straight from the SEC filing.
Volume thrusts
A forceful one-day move on heavy volume, closing near its own extreme, arriving after the stock has been beaten down or run up.
Candle patterns
Hammers, engulfing bars, kickers and morning and evening stars — the reversal candles worth knowing, filtered by where they printed and by the GekkoIndex so you only see the ones that matter.
Reversals
Price exhaustion after a run of consecutive new highs or new lows — a marker for where a move ran out of road.
Built to be read at a glance
Position tells you direction before colour does. Bullish markers sit below the bar, bearish above it — you can read the chart before you have processed a single colour.
Hover any marker for the detail behind it: the contract, the size, the date. Toggle each layer on or off, draw your own trendlines and levels, switch between daily and weekly bars, and move between one month and five years of history.
Every marker family owns its own shape and its own place in the stack, so the chart stays readable even when several land on the same day.
More about smart money charts →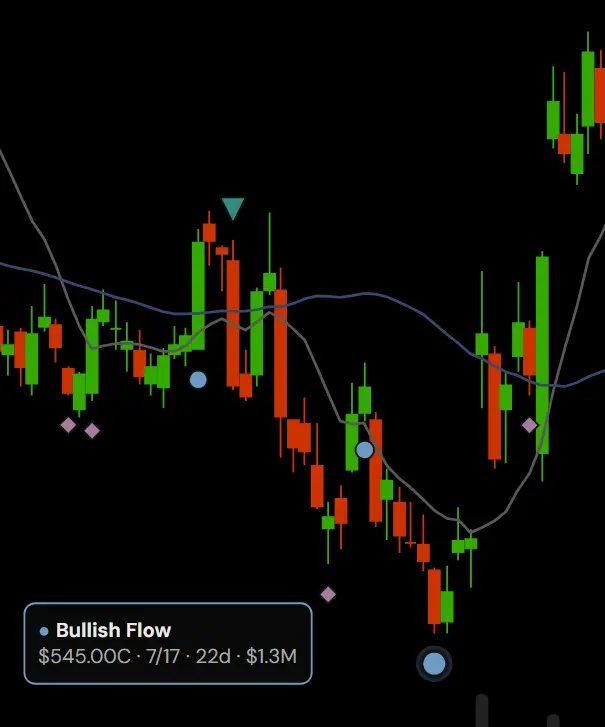
One score for the whole smart money picture
The GekkoIndex™ is a 0–100 score on every stock and ETF, updated through the trading day. It takes the institutional footprints scattered across filings, flow and price behaviour and turns them into one number you can read at a glance — the anchor the rest of Gekko is built around.
Sort the market by it, filter by it, plot it over price, and check how a stock has historically behaved after entering each zone — 5, 10, 20, 30 and 50 trading days out.
Read the GekkoIndex™ whitepaper → More about the GekkoIndex™ →
What is it actually worth?
Gekko Fair Value gives every stock a single estimate of its underlying value, from a proprietary model that weighs a company's fundamentals against how the market is pricing it. One gauge tells you whether the price sits above or below that estimate, and by how much.
More about Gekko Fair Value →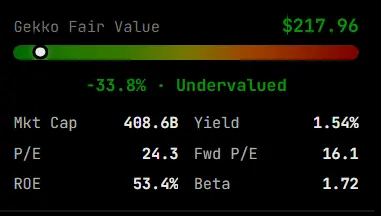
Why is it moving today?
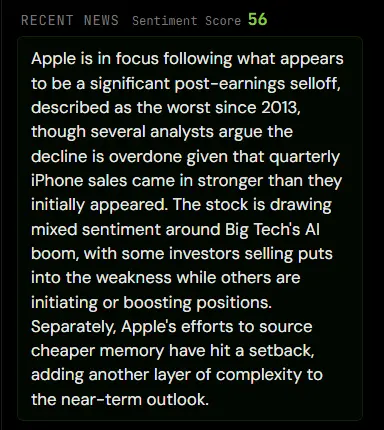
Instead of scrolling twenty headlines, read one plain-English summary of what is driving any stock right now — written from the day's news and scored for sentiment. It takes about fifteen seconds to get the story.
Who is buying their own stock
A live feed of open-market insider purchases from Form 4 filings — the CEO, CFO or 10% owner putting their own money in — with the size, the price and the date it became public, plotted on the chart and listed in one place.
More about the insider tracker →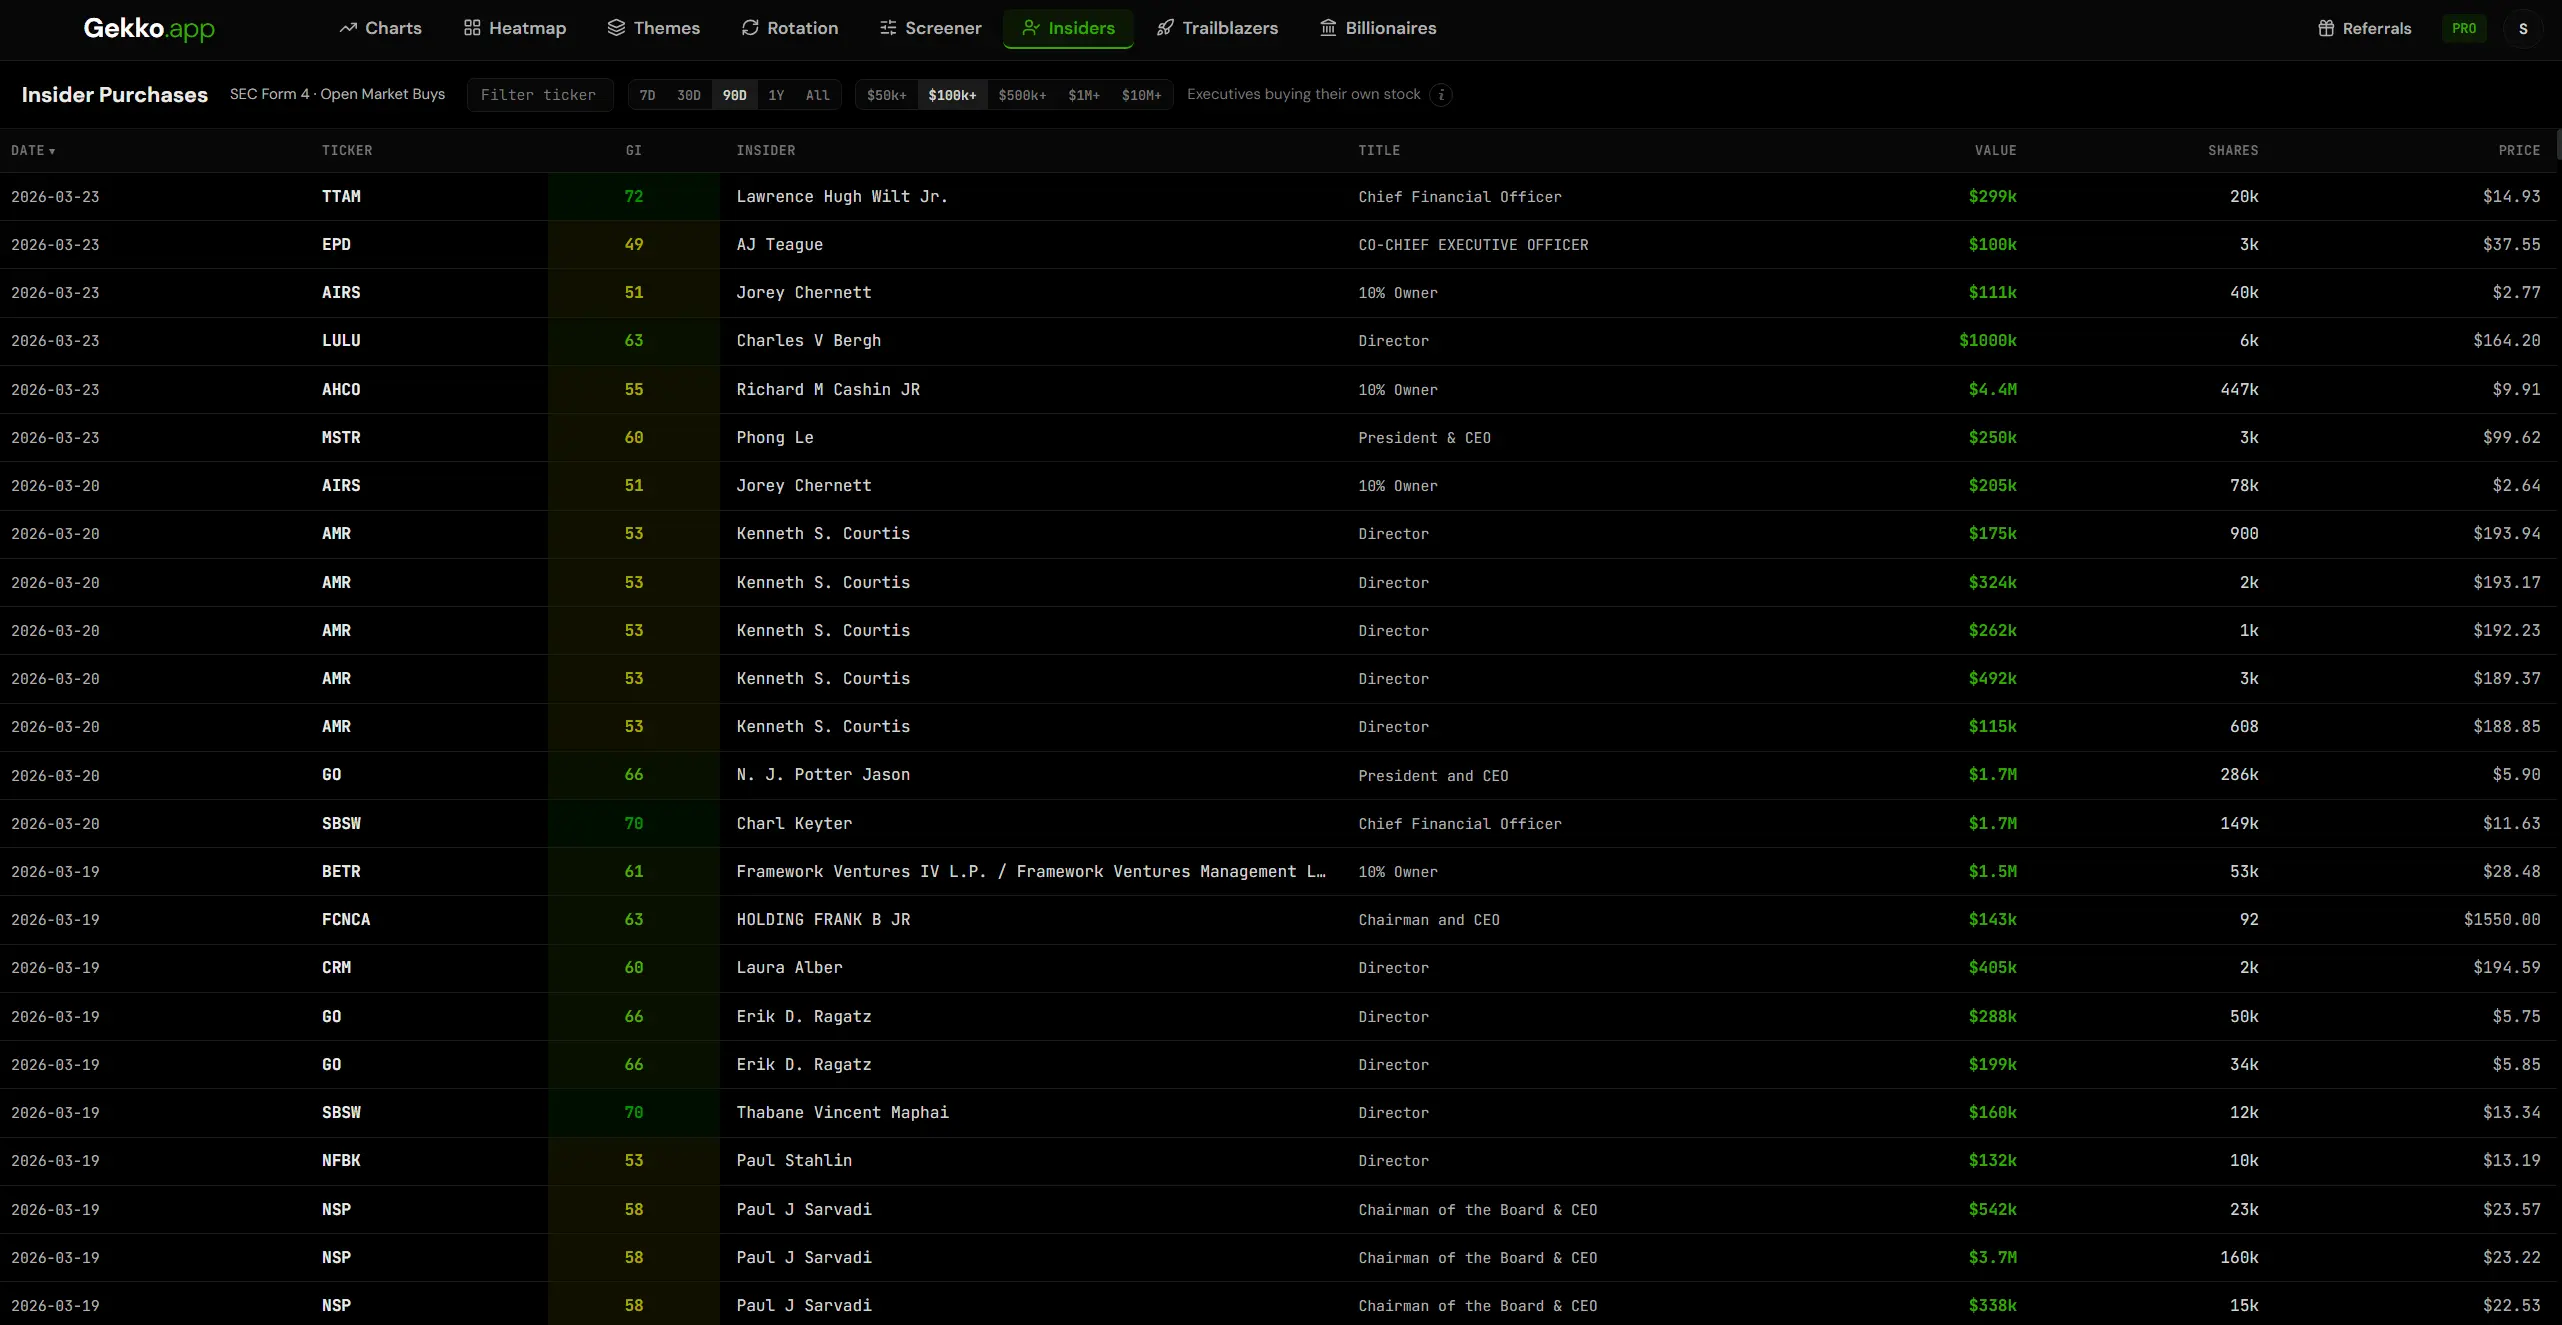
What politicians disclosed
House and Senate trading disclosures, each dated to the day it became public rather than the trade date, with the chamber, the member and the amount range — on the chart and in a feed you can filter by ticker.
More about the Congress tracker →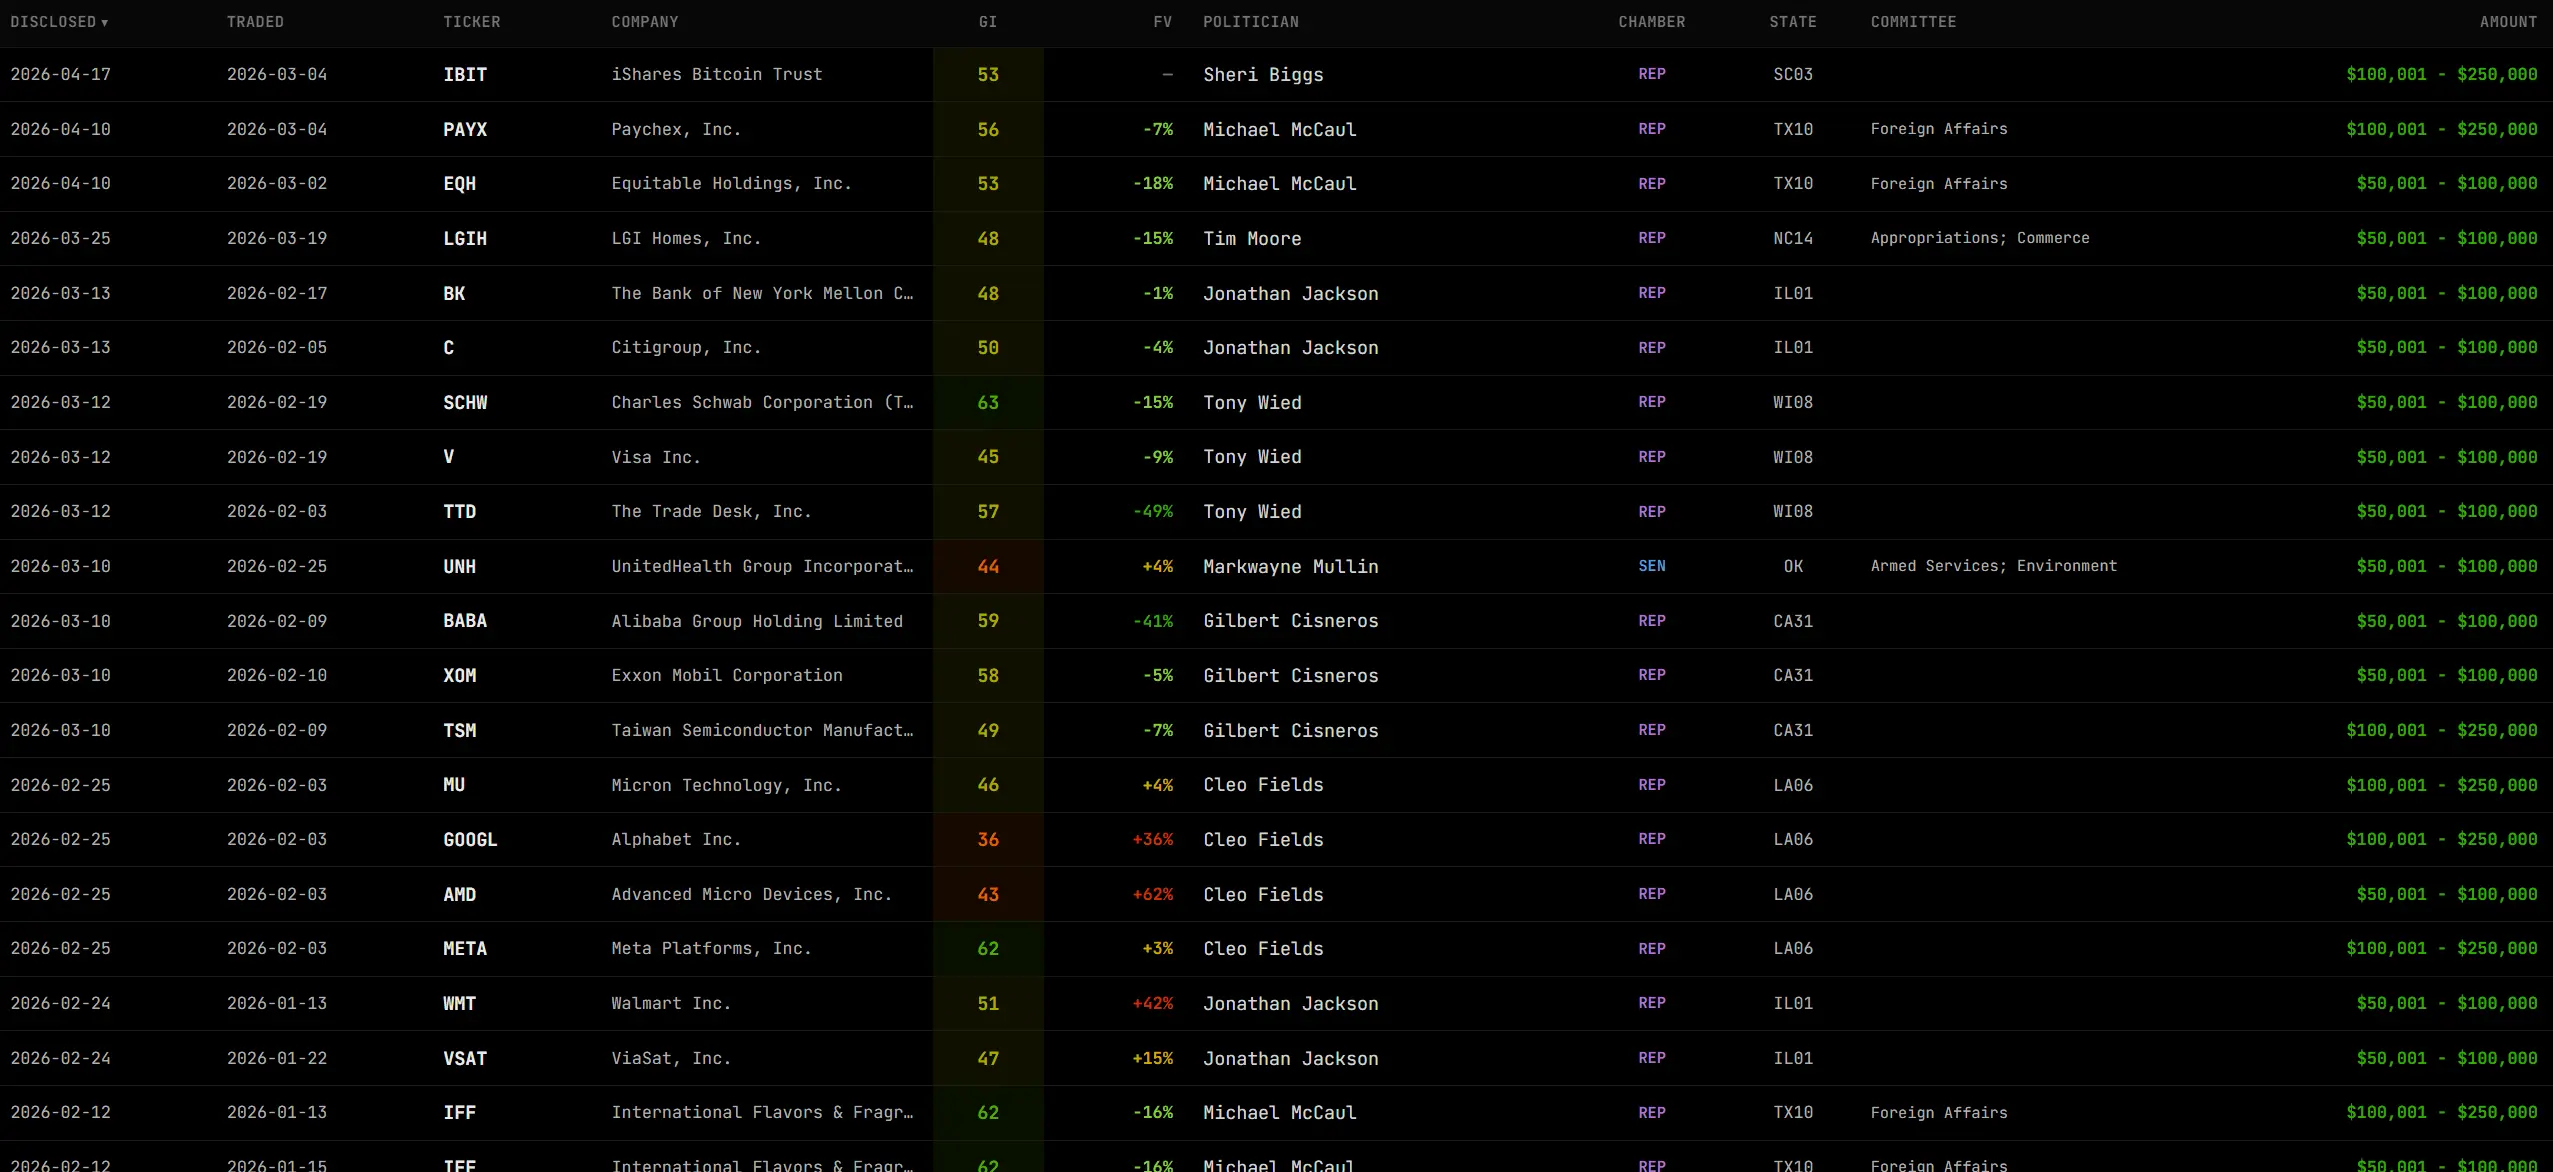
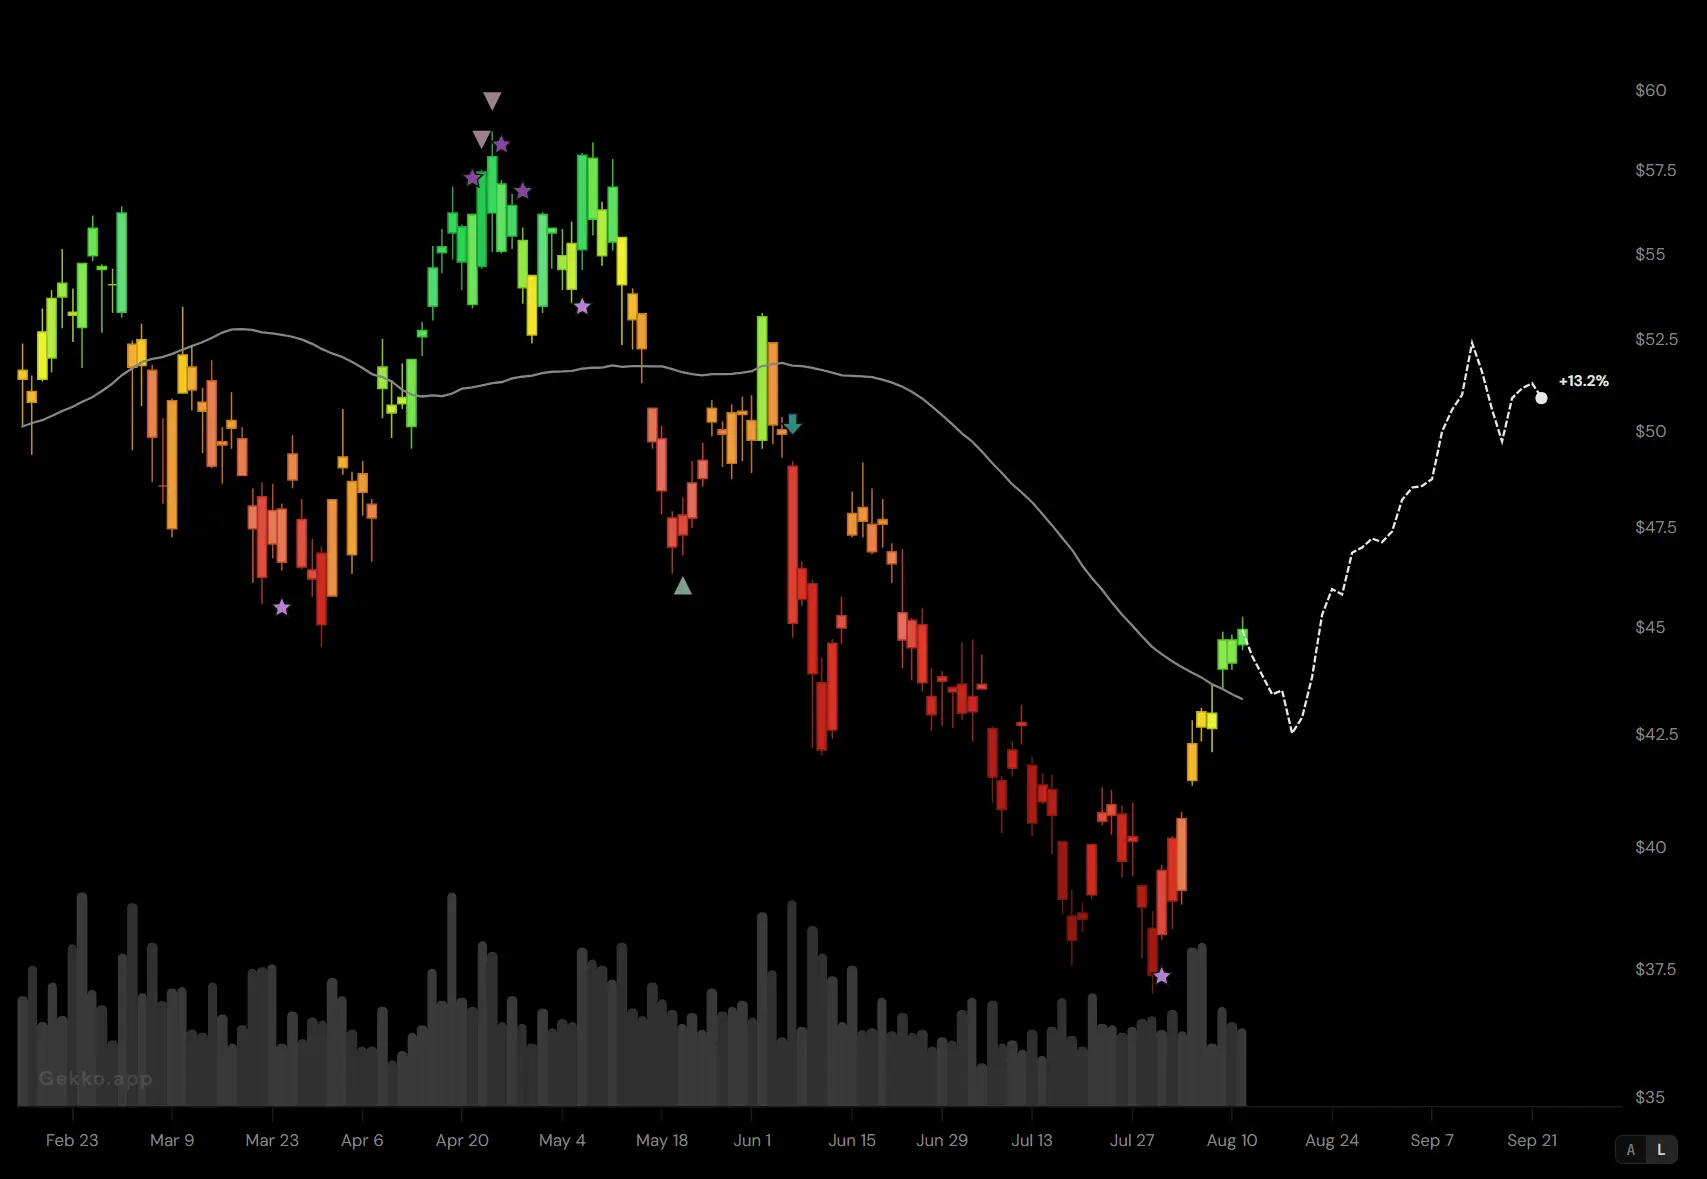
Seasonality trends right on your chart
See how any stock or ETF has historically performed over the same period ahead. The projection is drawn forward from today's close on the chart you already read, so you never hold two windows side by side.
- Average move over the next 5, 10, 15, 20 and 30 trading days
- How often it finished higher, and how that compares to its own baseline
- Built from five years of history on every name we cover
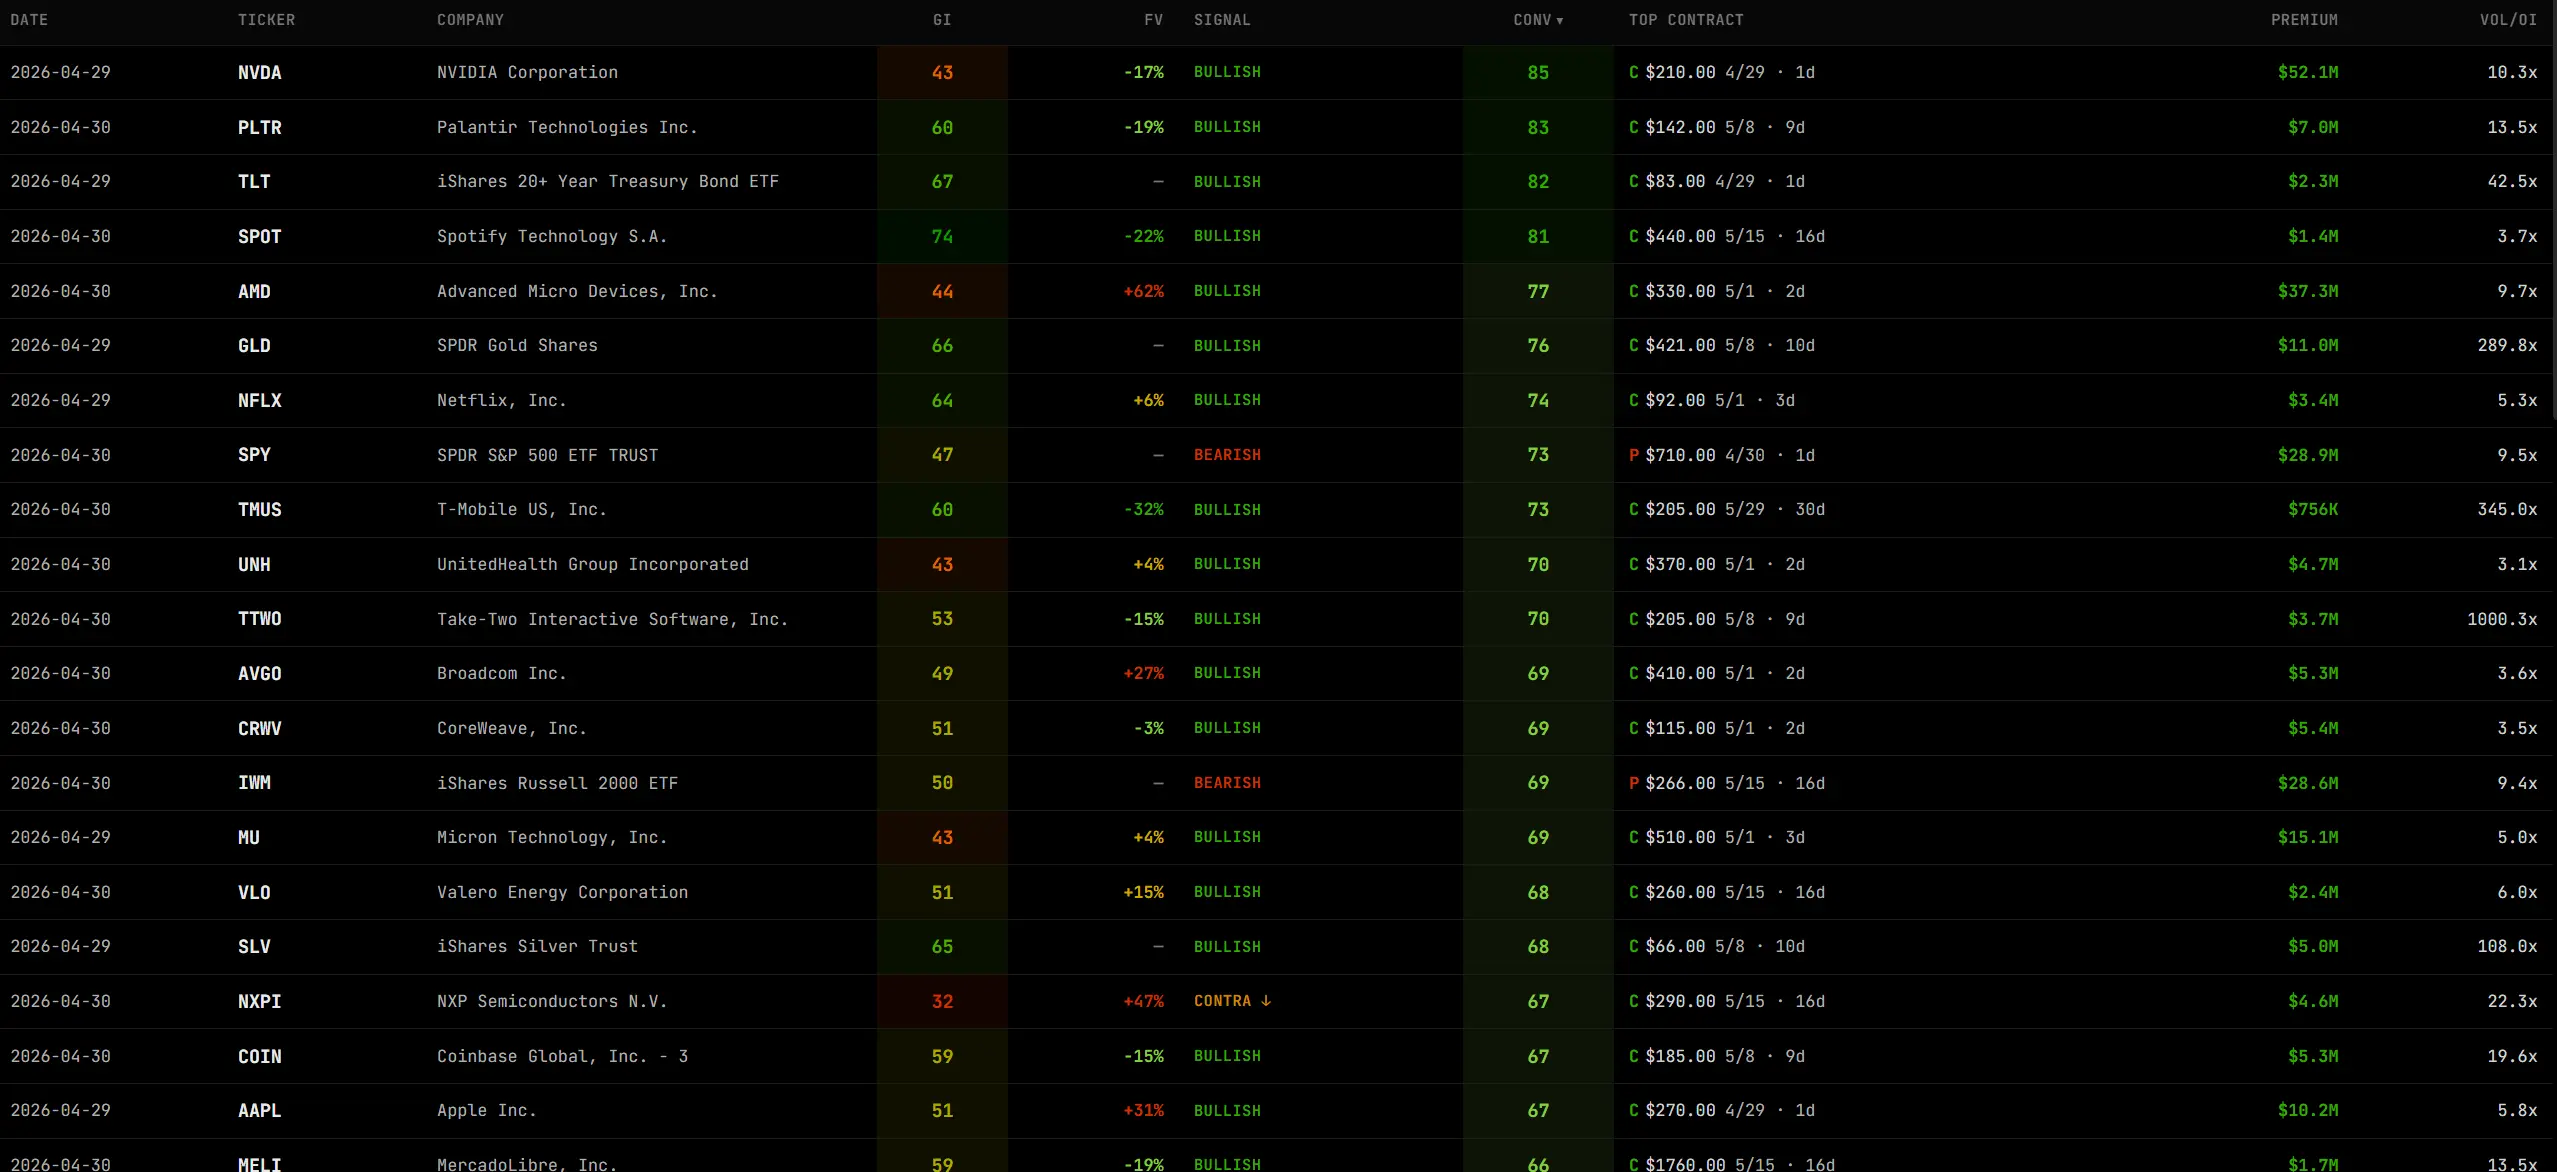
The big bets, ranked daily
A daily feed of unusually large options positions across the 2,000 most active tickers. Each one shows the exact contract, the premium behind it, how far volume ran ahead of open interest, and whether it reads bullish, bearish or contrarian.
- Sized against each company, so mid-caps are not drowned out
- Filter by ticker, direction, or the last 30 / 90 days
- Every row carries the GekkoIndex and Fair Value alongside it
A pipeline of ideas to research
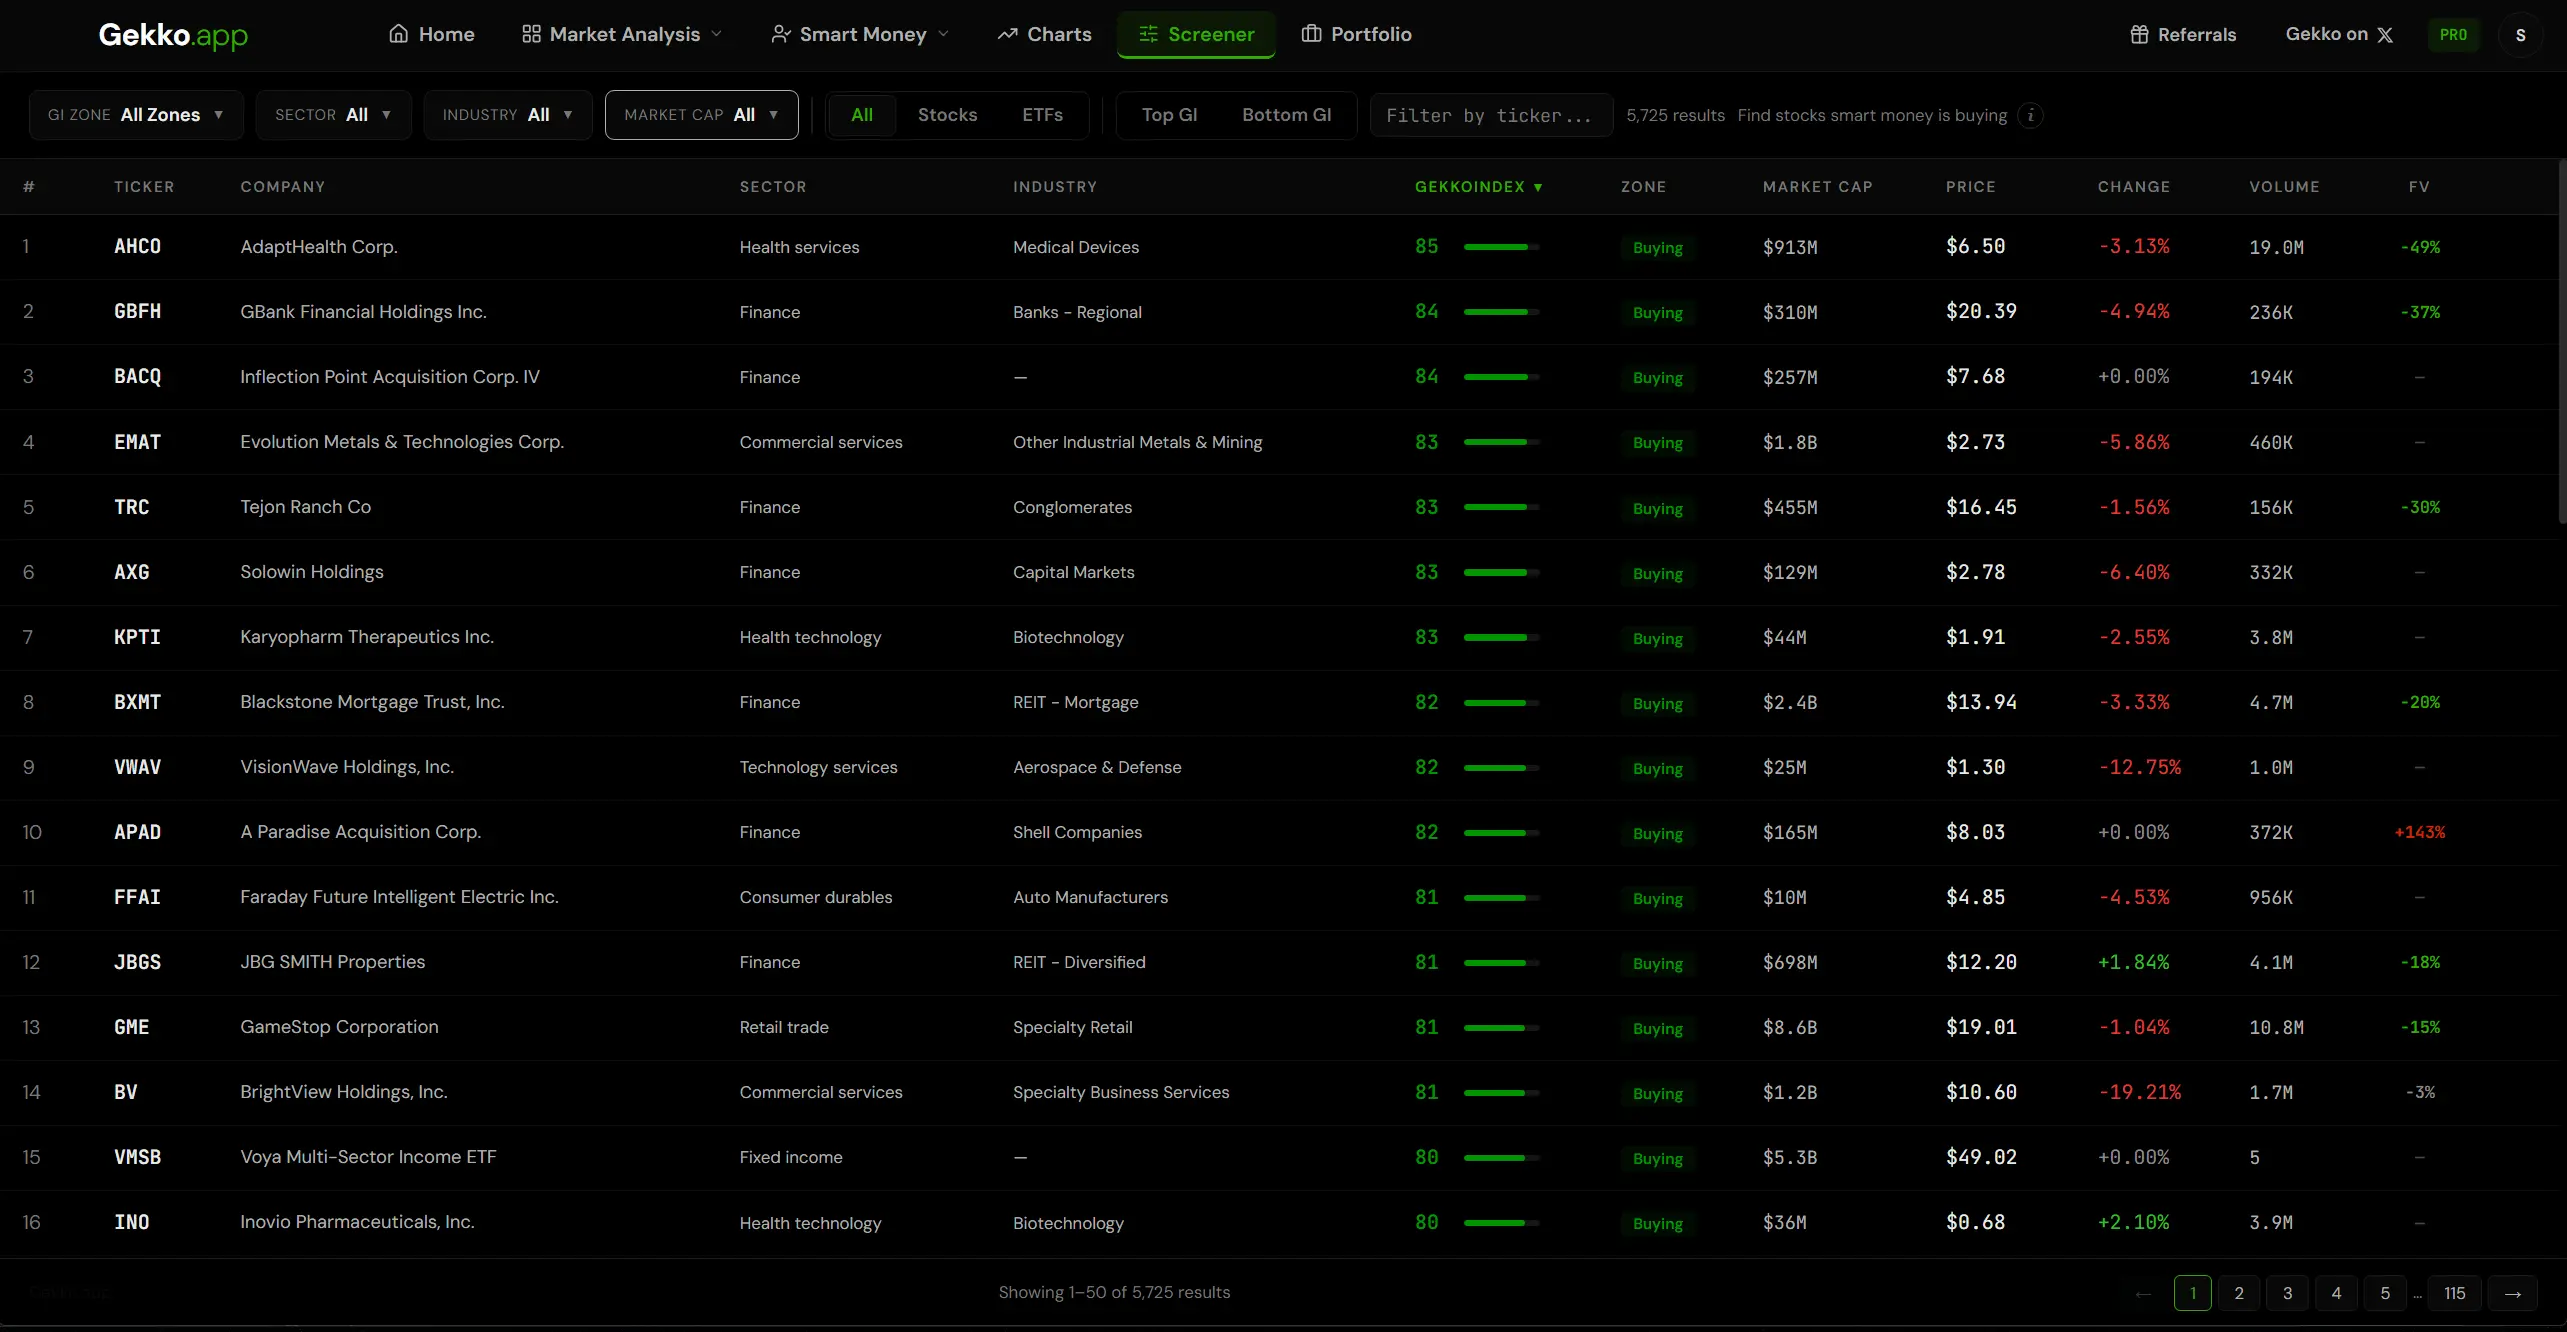
A stock screener that ranks all 5,800 US stocks and ETFs by GekkoIndex, then narrows by zone, sector, industry or market cap. Start from the names smart money has been active in rather than from a blank search box.
- Top and bottom of the market in one click
- Fair Value shown beside every result
- Jump straight from any row to its chart
Plan it before you act
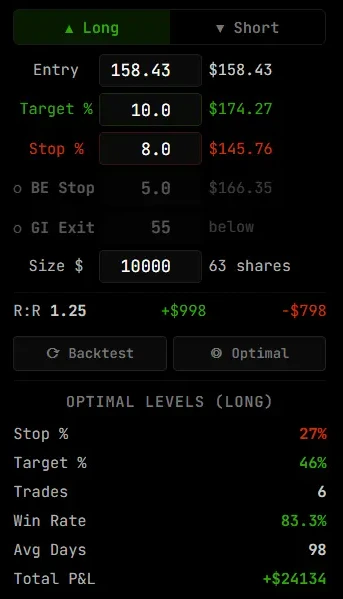
Set a hypothetical entry, stop and target on any stock and see the risk-to-reward straight away. Then backtest that setup against the stock's own signal history to study how those levels would have behaved, and let the optimizer suggest the levels the history favoured.
Backtests are hypothetical and shown for research and education only. They do not predict or guarantee future results.
Zoom out to the whole market
Before you commit to a stock, it helps to know what the rest of the market is doing around it.
Heatmaps
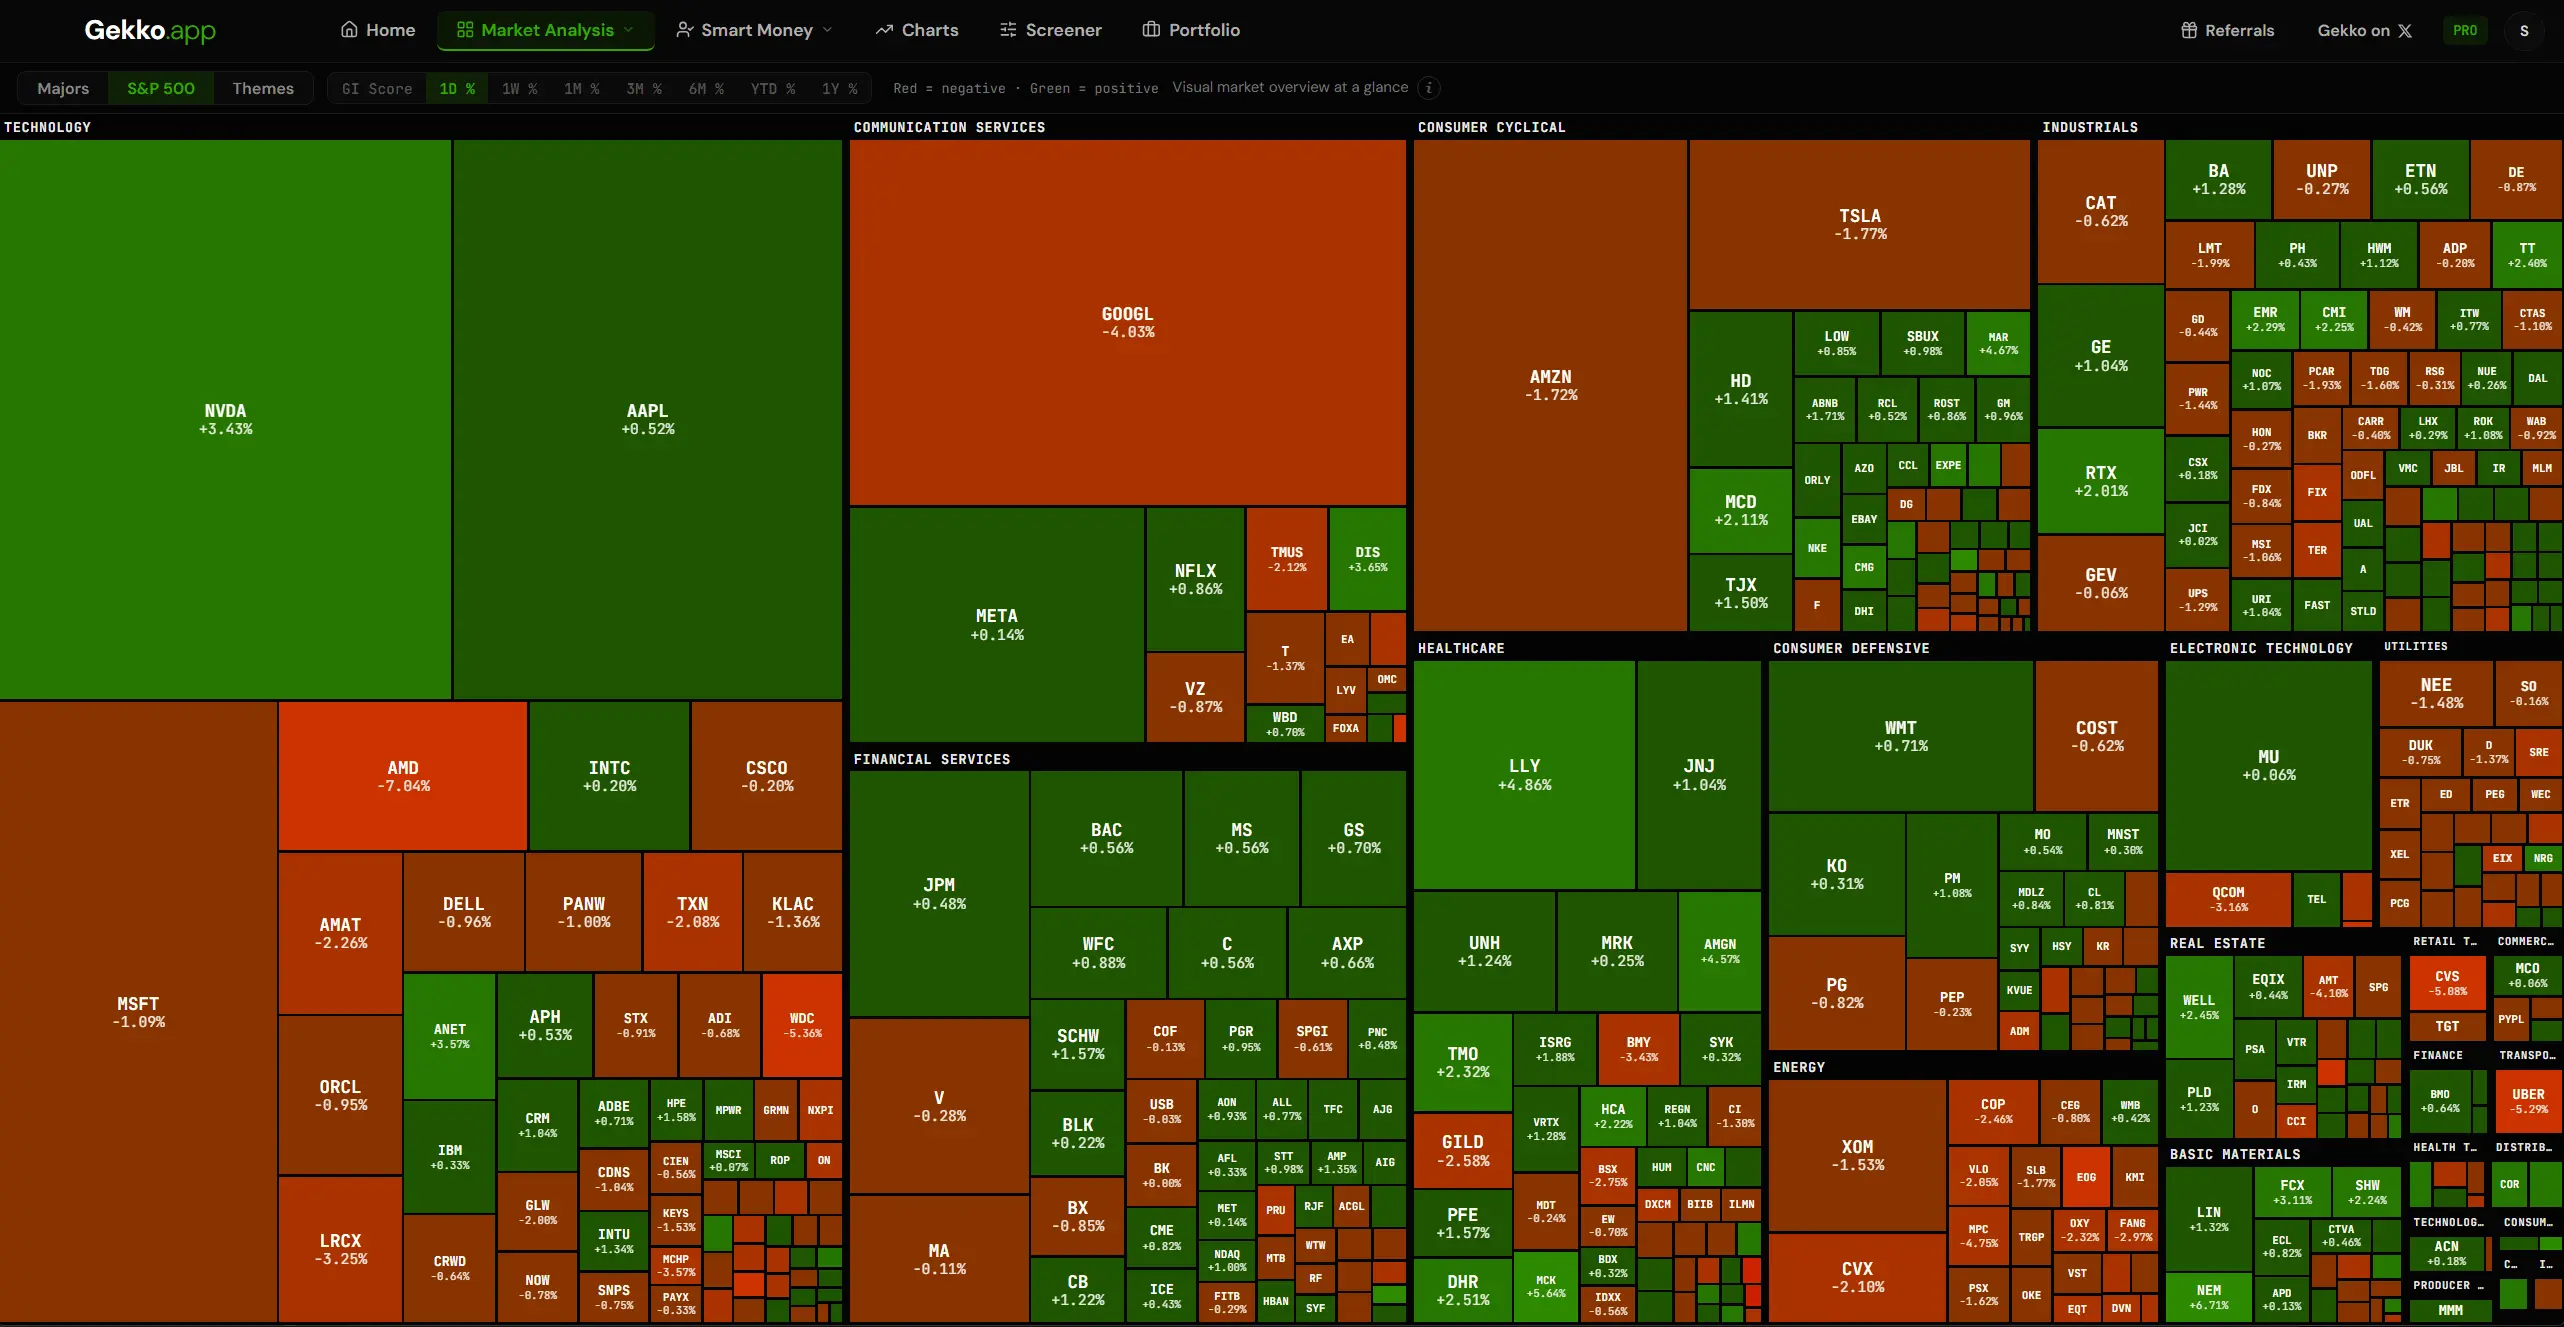
The whole S&P 500, the majors, or 276 themes — coloured by performance or by GekkoIndex, across seven timeframes.
Rotation
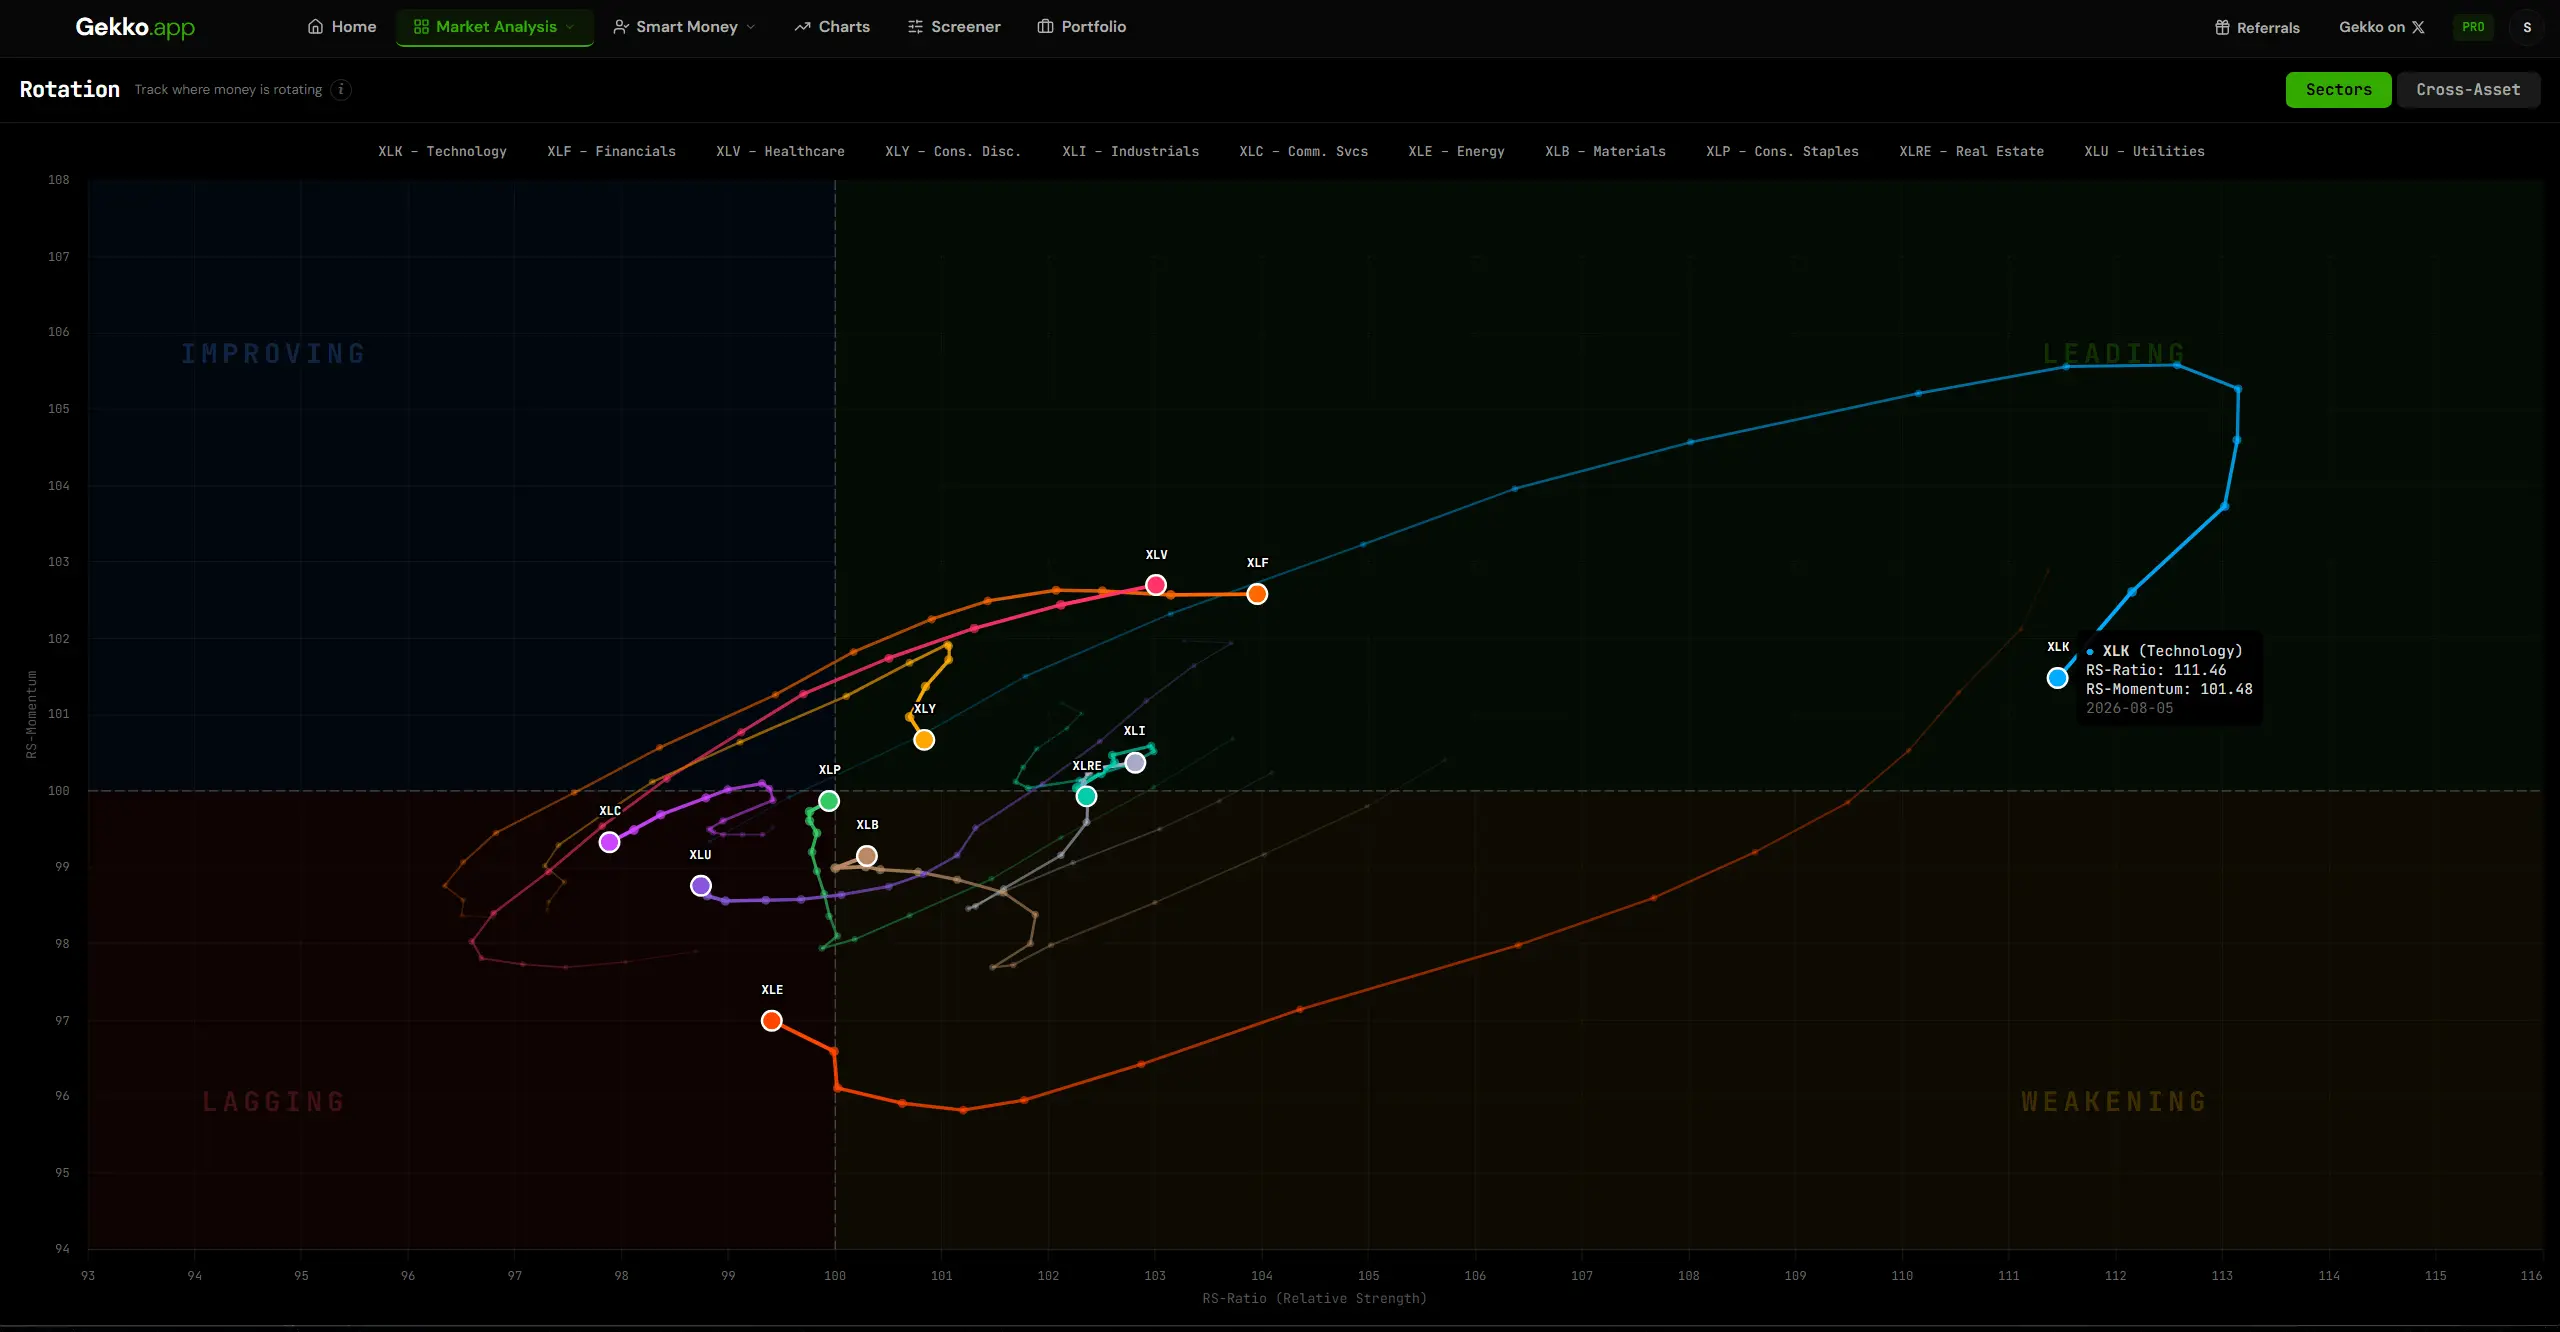
Watch money move between sectors and asset classes as they cycle through leading, weakening, lagging and improving.
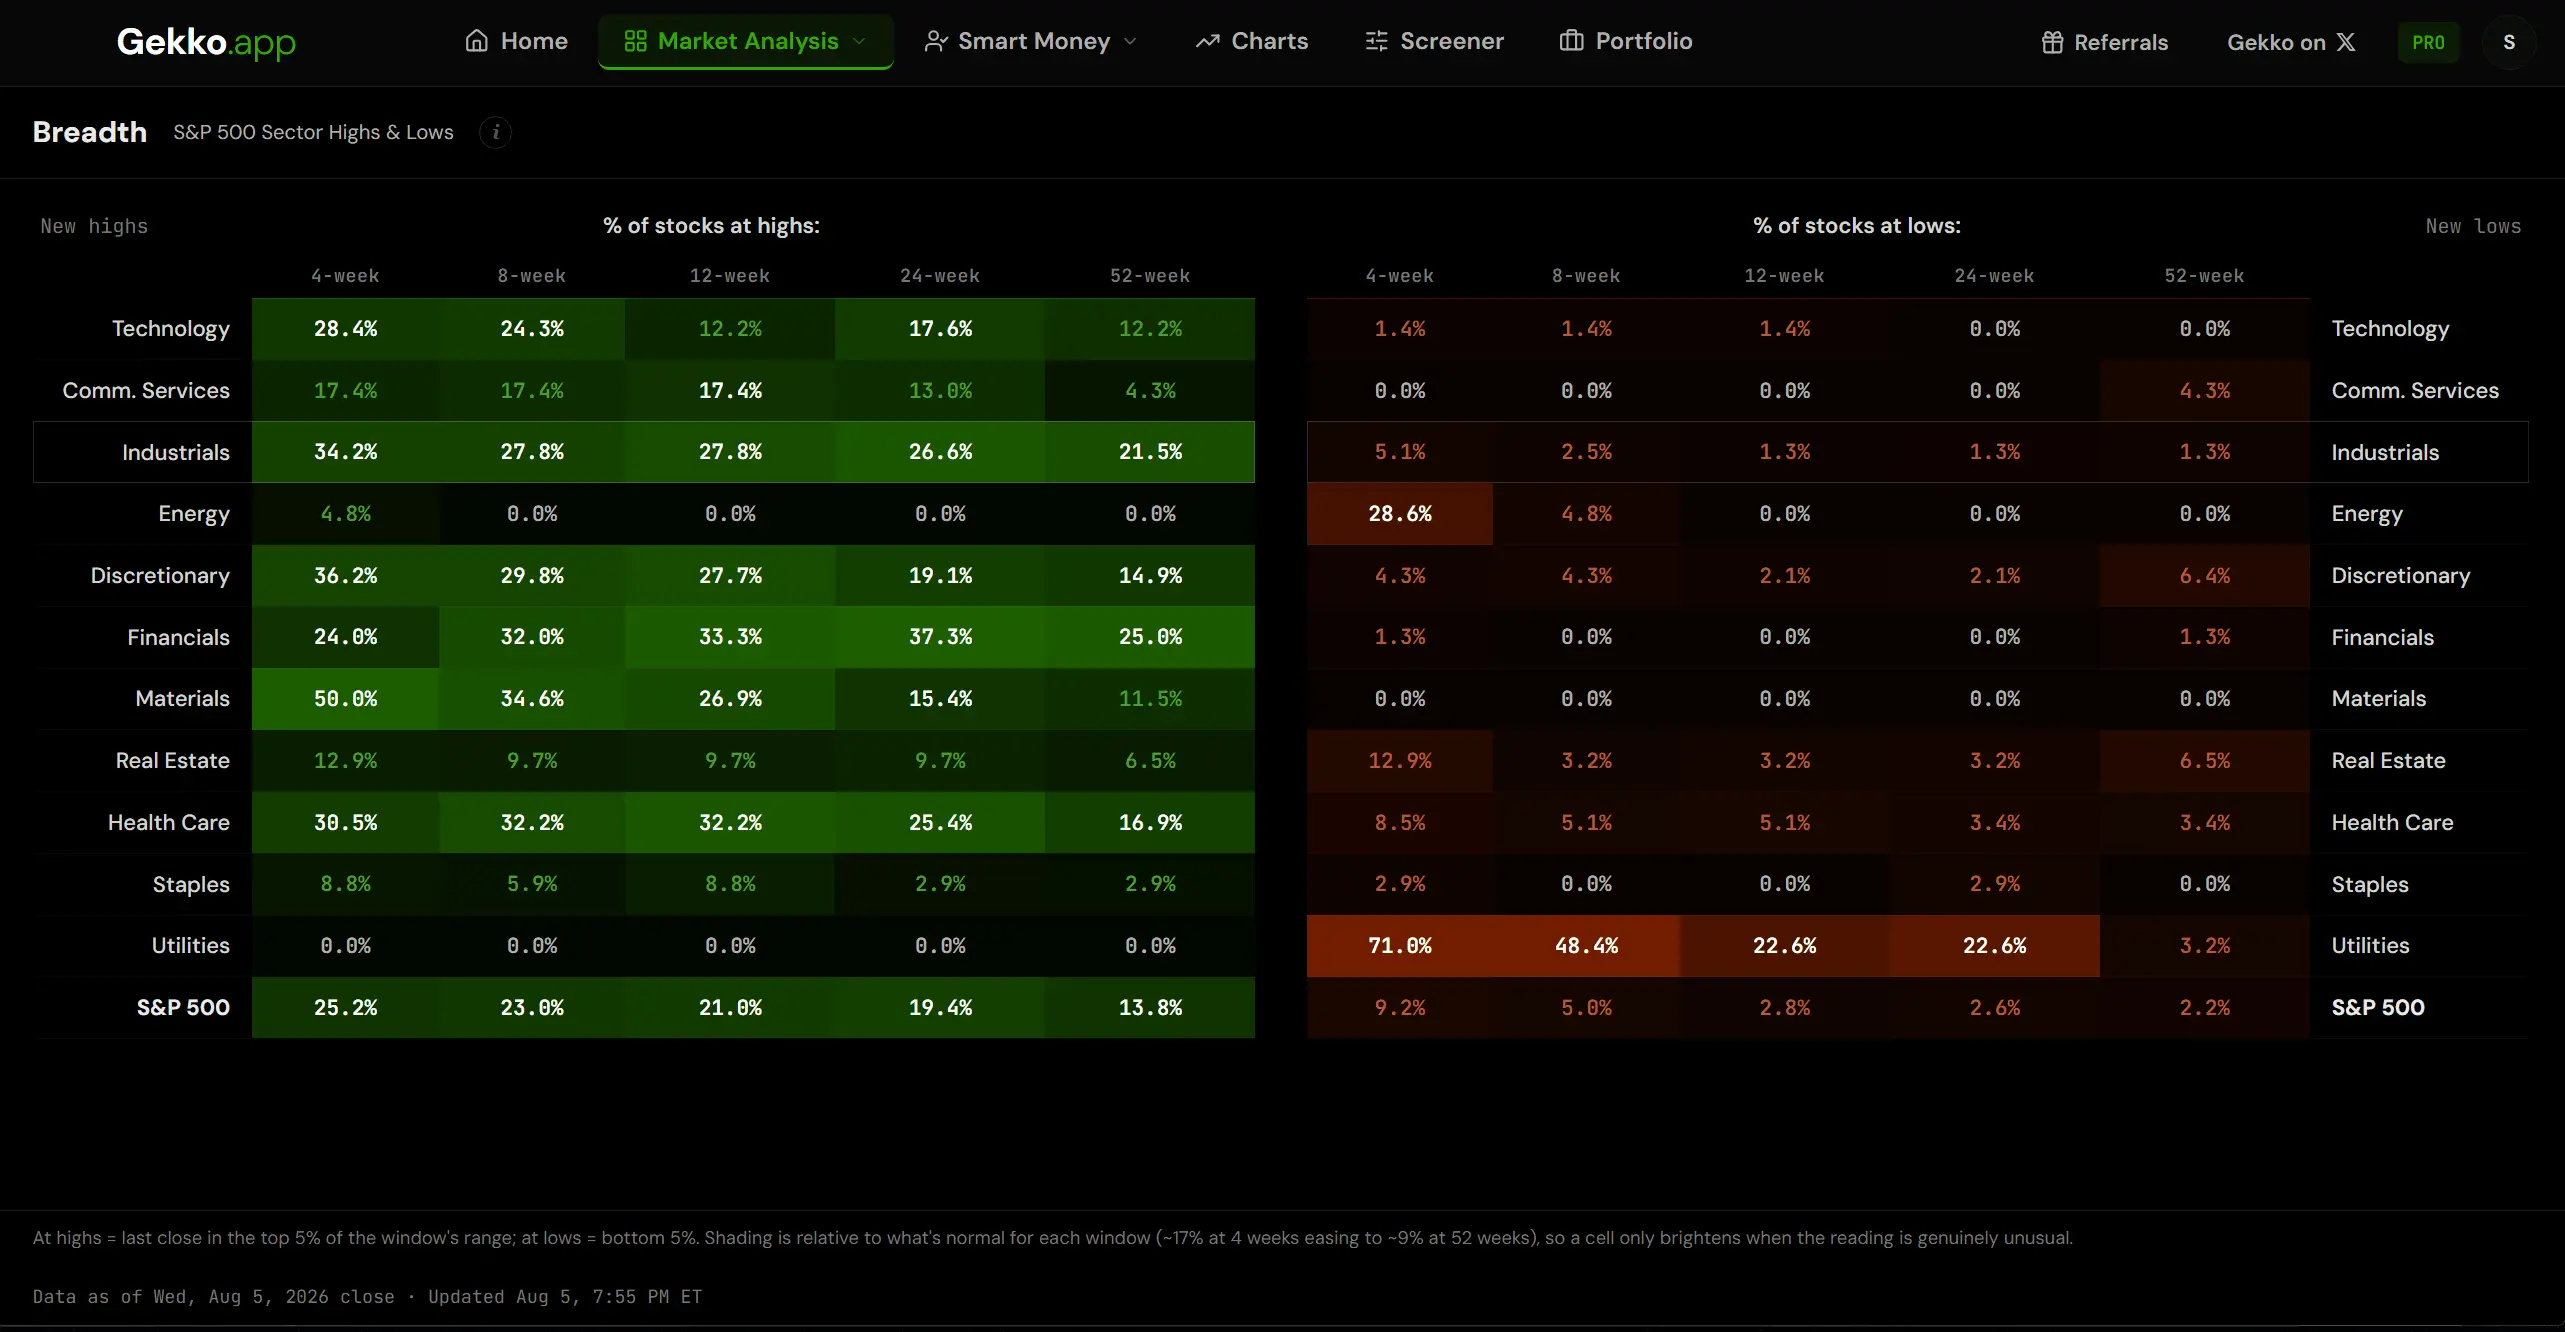
Breadth
See whether a rally is broad or being carried by a handful of names, sector by sector, across five timeframes.
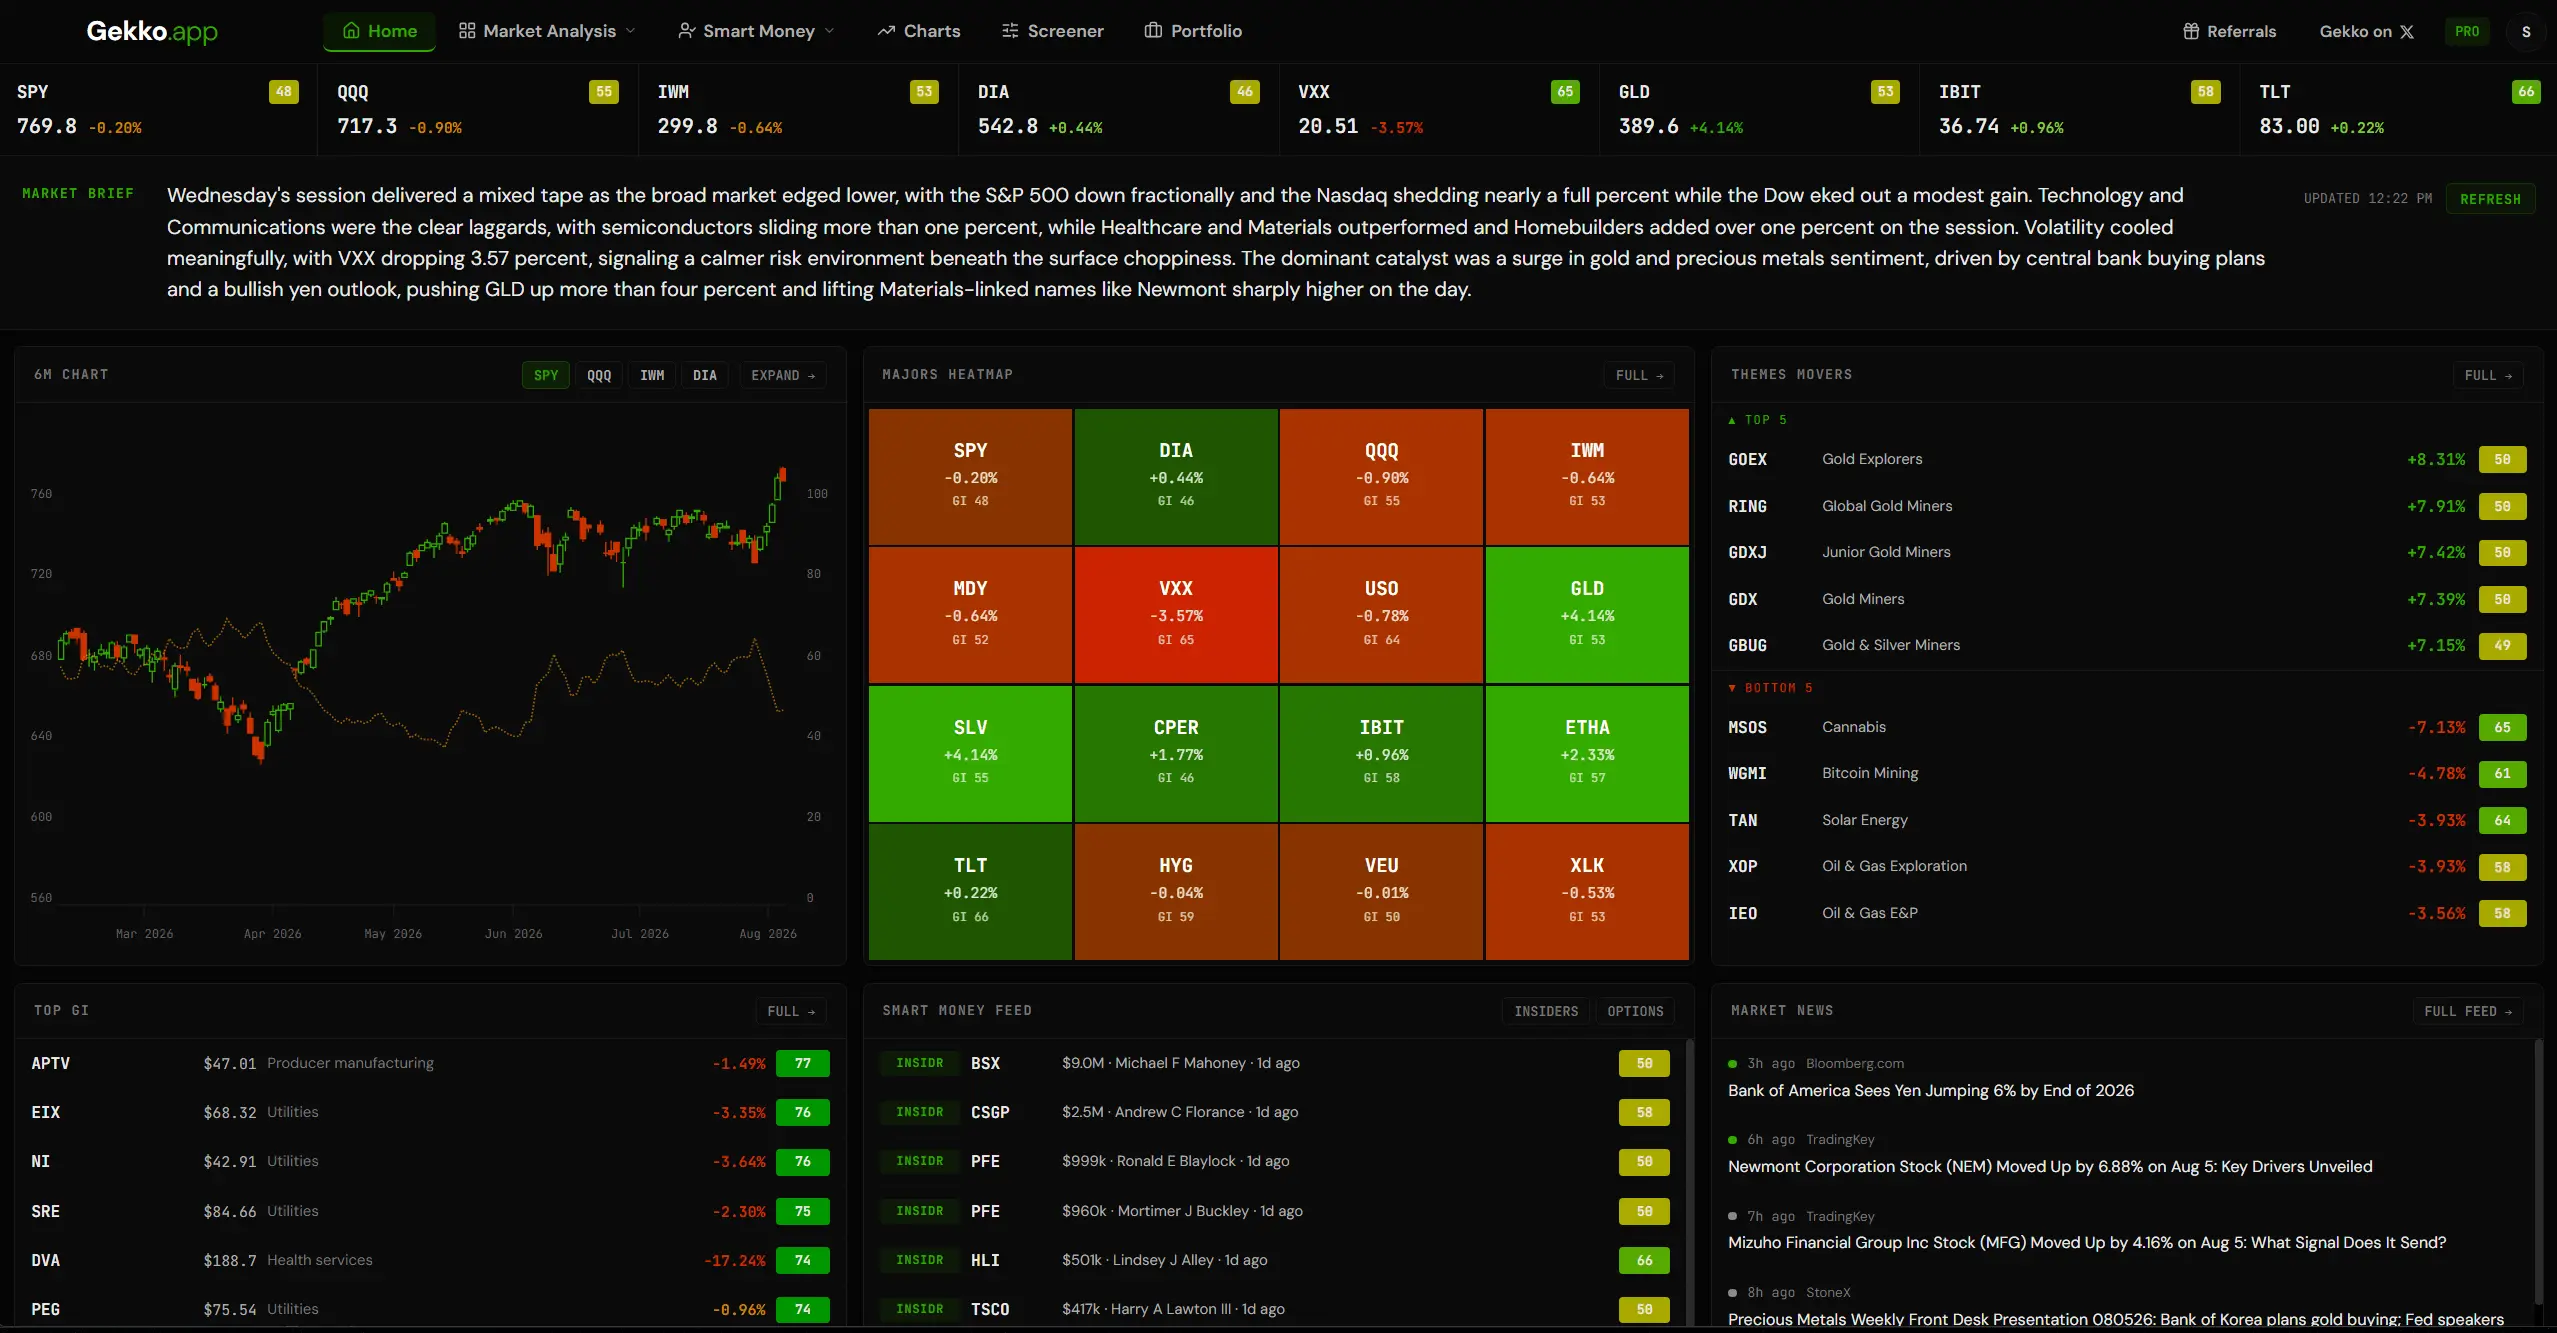
The whole session in one screen
Open Gekko and the day is already laid out: a written brief on what moved and why, the majors with their scores, the biggest theme movers, the top-ranked names, and a live feed of insider and options activity as it lands.
Track your own holdings in the portfolio tool too, with the GekkoIndex and Fair Value shown on every position so you can see where your whole book stands at a glance.
Get AI-generated trade ideas
Every day Gekko AI scans all of its smart money data to produce trade ideas you won't find anywhere else, each with backtested entry, stop and profit target levels. ChatGPT and other chatbots don't have this data.
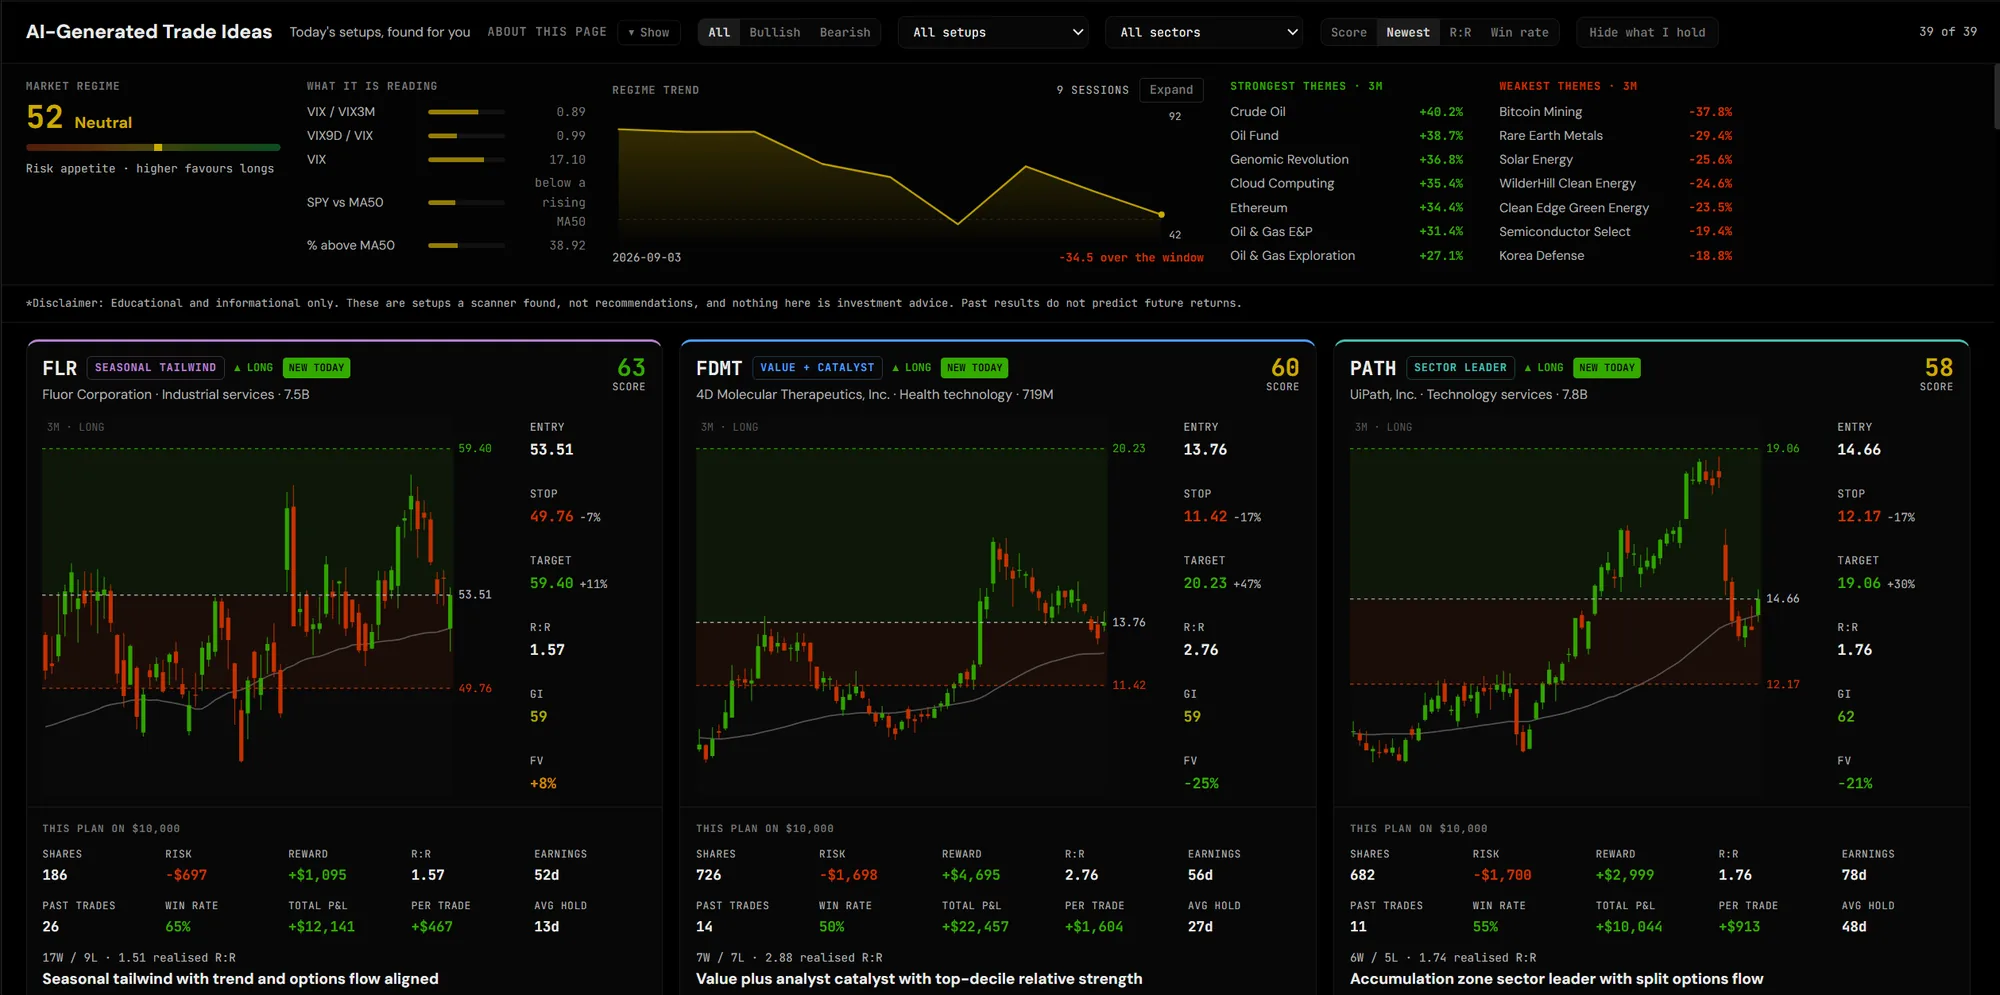
Every card carries the backtest behind it — past trades, win rate and average hold, on the same screen as the plan.
Get real-time trade alerts sent to you
Gekko sends you a notification or an email whenever your stock or trade hits a level you set, so you never miss an opportunity.
- Set them straight from the chart — entry, stop, target or break-even
- Price, GekkoIndex or Fair Value premium, your choice of trigger
- Checked every fifteen minutes through the session
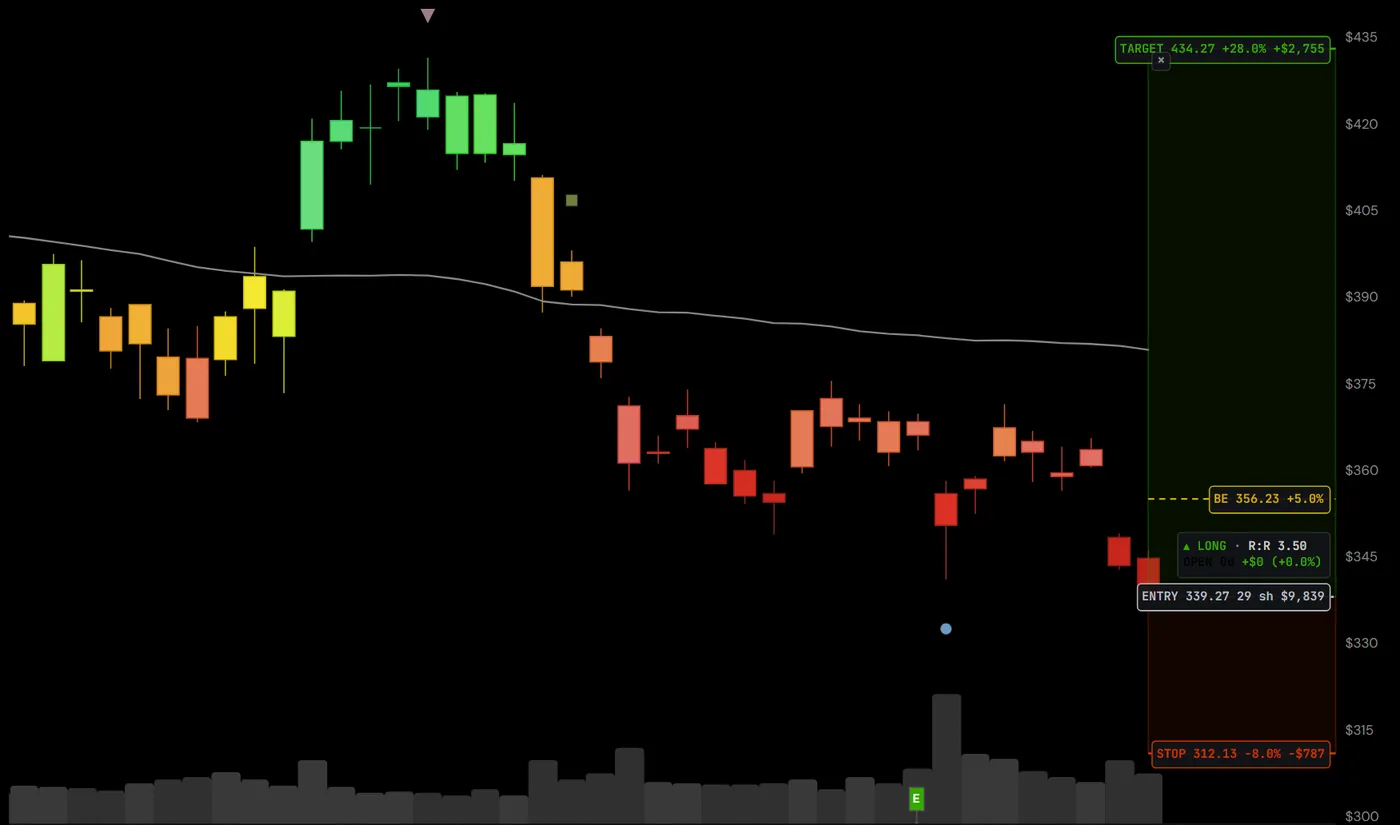
Experience the power of TrendCandles™
Our new chart type colours every candle by the strength of the trend, so you can spot potential turning points and developing trends early.
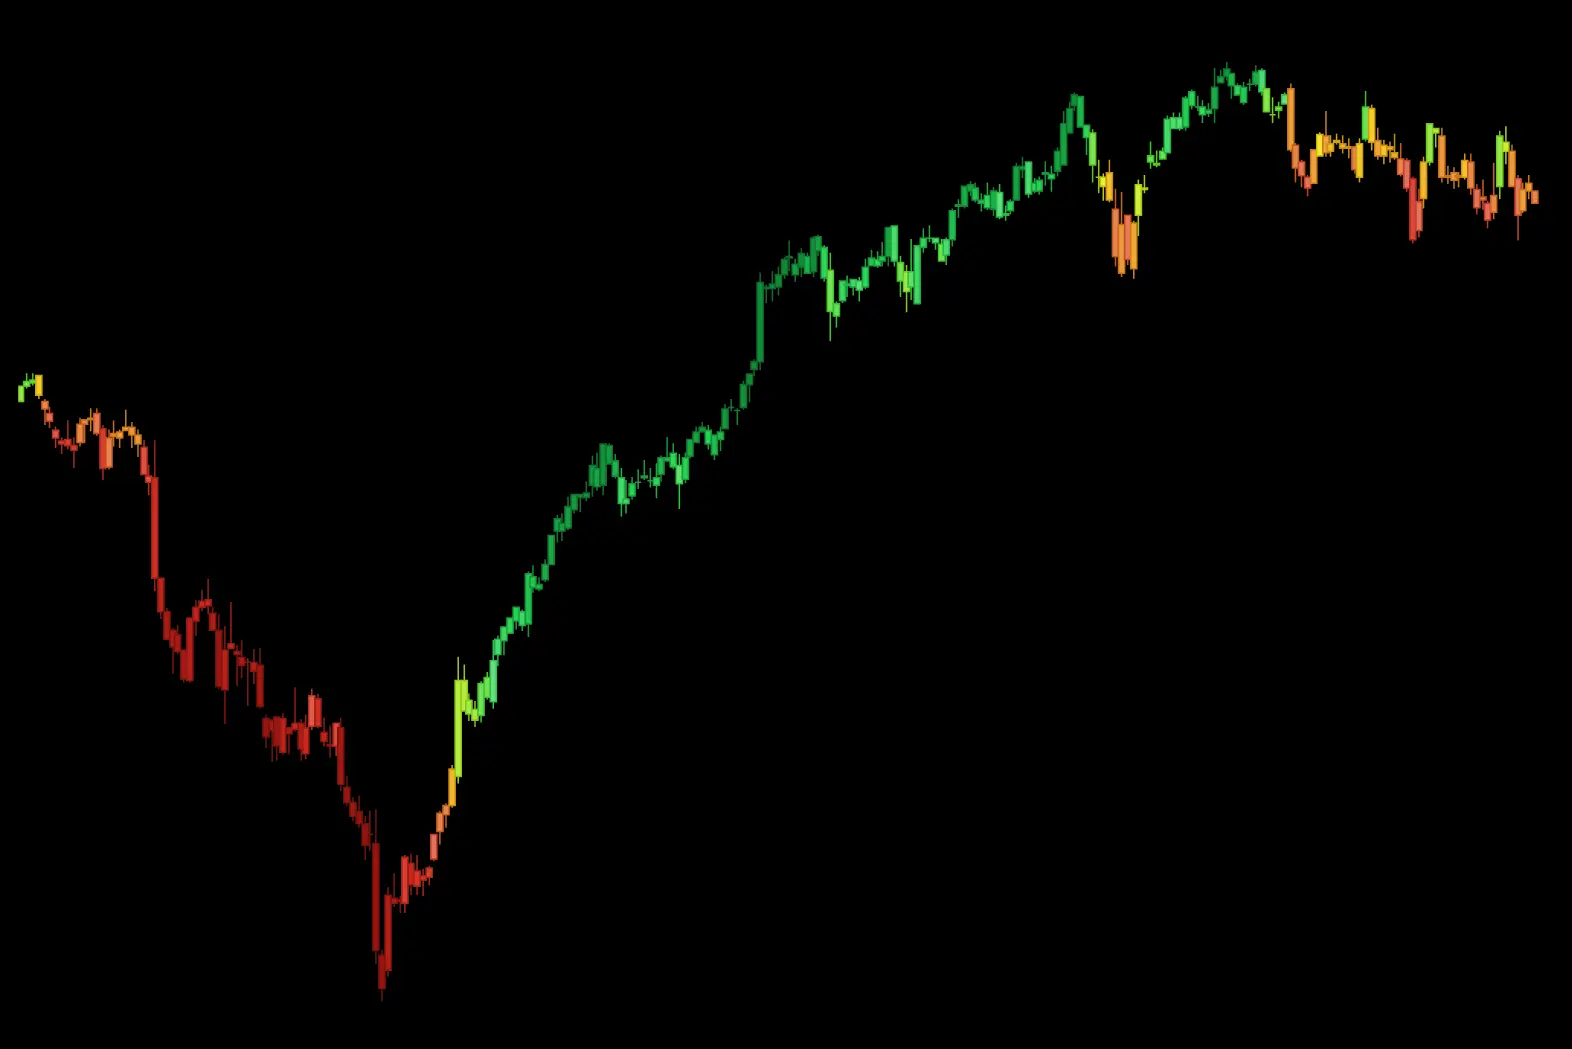
Deep green to deep red, with every shade between. The colour is the trend — read the whole chart in one pass.
The turn shows up before the breakout
Candles pale as a trend loses its grip and deepen as it takes hold, so a move that is quietly changing character looks different long before it clears an obvious level.
Works on every ticker, day one
No warm-up period, no minimum history and no dependency on any other signal. Every US stock and ETF we cover, on daily or weekly bars.
Proprietary to Gekko
Built in-house and available nowhere else. Sit it alongside the smart money markers and you get positioning and trend in a single view.
Dig deeper into any company
Up-to-date fundamentals on every stock we cover. Revenue, profit, margins, growth and the metrics that matter — charted over years, not buried in a filing.
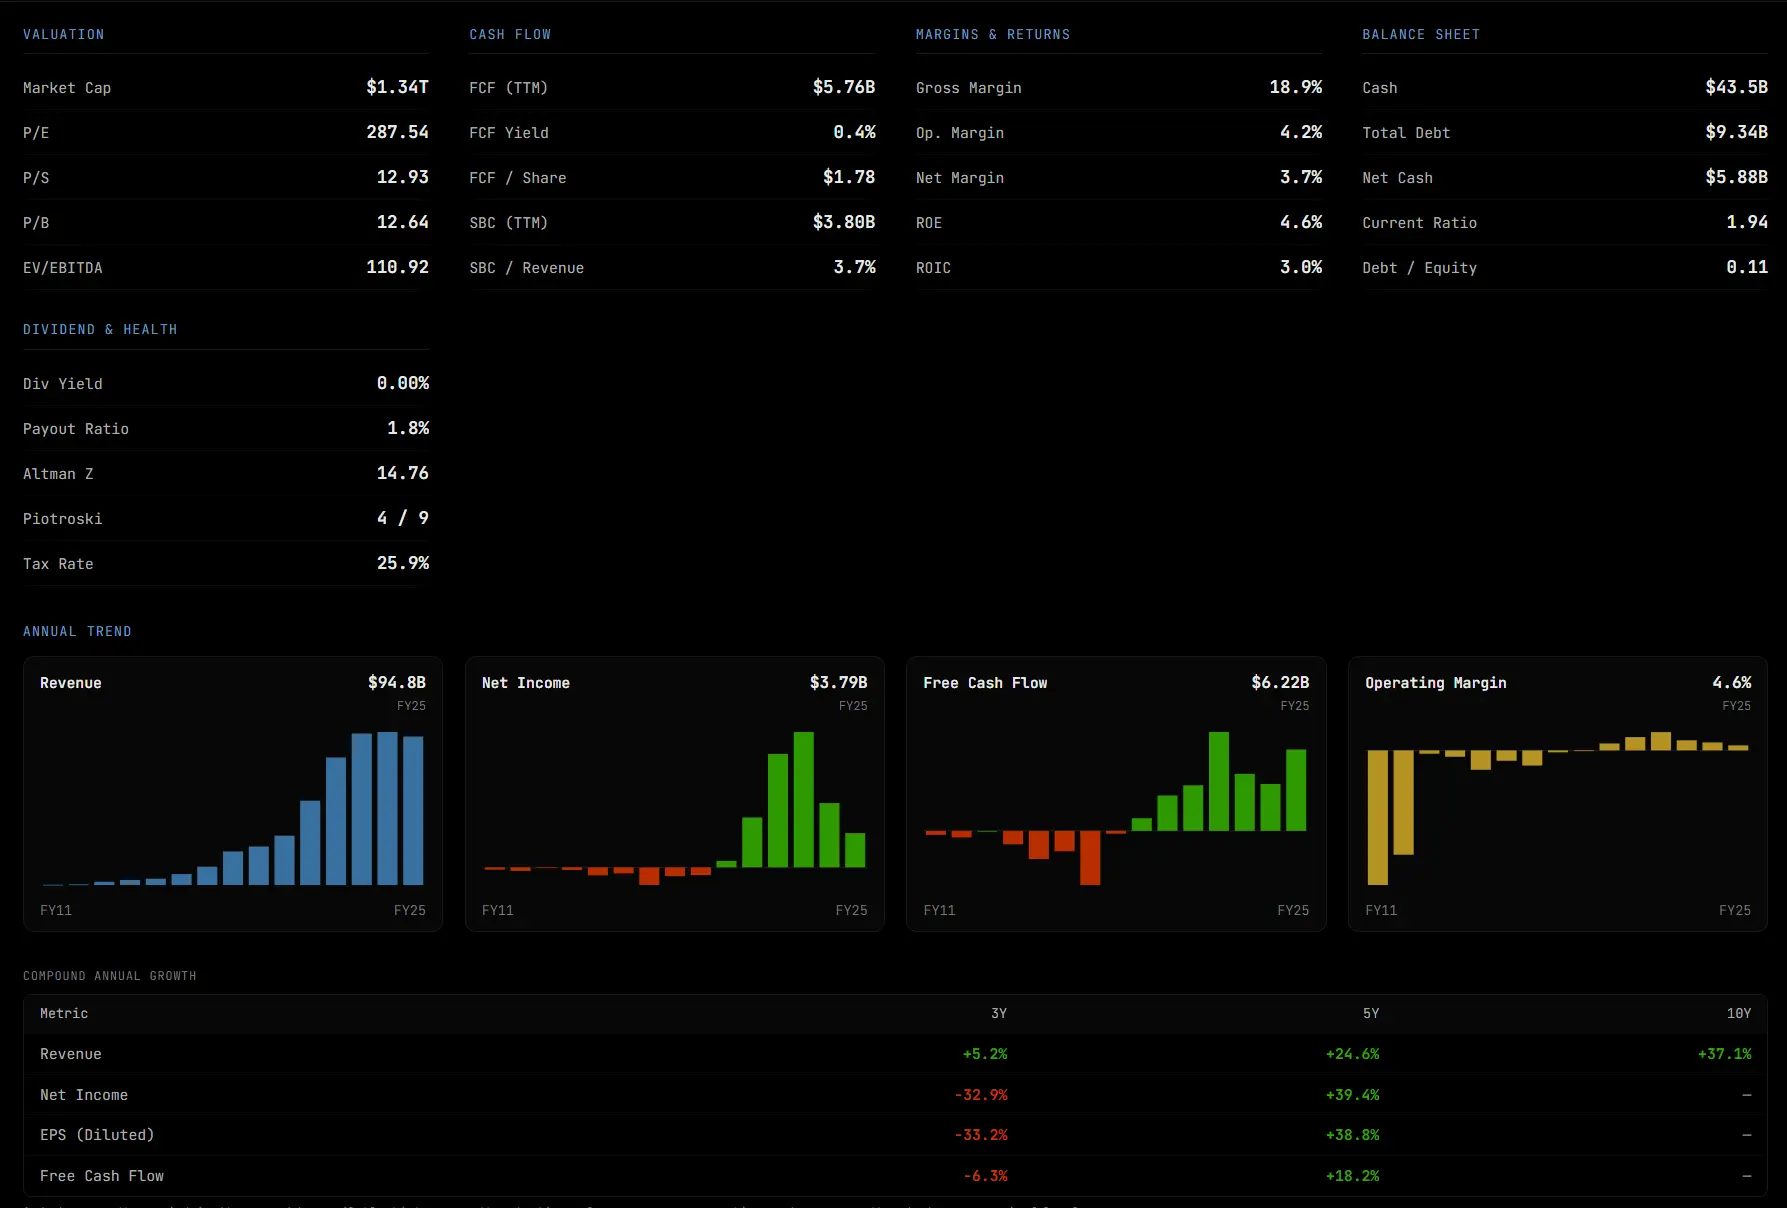
Five tabs, around thirty charted metrics, revenue by segment and CAGR — on the same page as the chart.
The trend, not a snapshot
Every metric is plotted across years and quarters, so accelerating growth, quietly compressing margins and one-off blips are obvious at a glance.
See where the money comes from
Revenue broken out by product line and by geography, with compound growth on every series — so you know which part of the business is carrying the story.
Right beside the price
No switching to a separate research site and losing your place. Fundamentals sit on the same page as the chart, the GekkoIndex and the smart money markers.
And the rest of an all in one stock research platform
Everything above is only part of it. One login covers the lot — no add-ons, no upsells, no separate tiers. Here is some of what else is waiting inside.
More again beyond this list, with new tools shipping regularly — all included. Not a member yet? Gekko's free stock analysis pages carry the GekkoIndex zone, Gekko Fair Value and the smart money summary for 500 US stocks, and the methodology page explains what each measure means.
Join — other traders using Gekko
Start Your FREE 7 Day Trial →Every feature unlocked. No credit card required.
Every feature, free for seven days
Sign up with an email address and the whole platform is open — nothing to enter, nothing to cancel.
Join — other traders using Gekko
Start Your FREE 7 Day Trial → Every feature unlocked. No credit card required.